UNITED STATES
SECURITIES AND EXCHANGE COMMISSION
Washington, D.C. 20549
FORM 10-K
For the Fiscal Year Ended December 31 , 2025
Or
For the transition period from to
Commission File Number 1-7107
(Exact name of registrant as specified in its charter)
 | ||||||||
| (State of Incorporation) | (I.R.S. Employer Identification No.) | |||||||
| (Address of principal executive offices) | (Registrant’s telephone number including area code) | |||||||
Securities registered pursuant to Section 12(b) of the Act:
| Title of Each Class | Trading Symbol | Name of Each Exchange on Which Registered | ||||||
Securities registered pursuant to Section 12(g) of the Act: None
Indicate by check mark if the registrant is a well-known seasoned issuer as defined in Rule 405 of the Securities Act. Yes ý No ¨
Indicate by check mark if the registrant is not required to file reports pursuant to Section 13 or Section 15(d) of the Act. Yes ¨ No ý
Indicate by check mark whether the registrant (1) has filed all reports required to be filed by Section 13 or 15(d) of the Securities Exchange Act of 1934 during the preceding 12 months (or for such shorter period that the registrant was required to file such reports), and (2) has been subject to such filing requirements for the past 90 days. Yes ý No ¨
Indicate by check mark whether the registrant has submitted electronically every Interactive Data File required to be submitted pursuant to Rule 405 of Regulation S-T (§ 232.405 of this chapter) during the preceding 12 months (or for such shorter period that the registrant was required to submit such files). Yes ý No ¨
Indicate by check mark whether the registrant is a large accelerated filer, an accelerated filer, a non-accelerated filer, a smaller reporting company, or an emerging growth company. See the definitions of “large accelerated filer,” “accelerated filer,” “smaller reporting company,” and “emerging growth company” in Rule 12b-2 of the Exchange Act.
| x | Accelerated filer | ☐ | |||||||||
| Non-accelerated filer | ☐ | Smaller reporting company | |||||||||
| Emerging growth company | |||||||||||
If an emerging growth company, indicate by check mark if the registrant has elected not to use the extended transition period for complying with any new or revised financial accounting standards provided pursuant to Section 13(a) of the Exchange Act. o
Indicate by check mark whether the registrant has filed a report on and attestation to its management’s assessment of the effectiveness of its internal control over financial reporting under Section 404(b) of the Sarbanes-Oxley Act (15 U.S.C. 7262(b)) by the registered public accounting firm that prepared or issued its audit report. ý
If securities are registered pursuant to Section 12(b) of the Act, indicate by check mark whether the financial statements of the registrant included in the filing reflect the correction of an error to previously issued financial statements. o
Indicate by check mark whether any of those error corrections are restatements that required a recovery analysis of incentive-based compensation received by any of the registrant’s executive officers during the relevant recovery period pursuant to §240.10D-1(b). o
Indicate by check mark whether the registrant is a shell company (as defined in Rule 12b-2 of the Act): Yes ☐ No ý
State the aggregate market value of the voting and non-voting common equity held by non-affiliates computed by reference to the price at which the common equity was sold, or the average bid and asked price of such common equity, as of the last business day of the registrant’s most recently completed second fiscal quarter: $5,897,870,878 .
Indicate the number of shares outstanding of each of the registrant’s classes of common stock as of the latest practicable date: 69,830,343 shares of common stock, $1 par value, outstanding as of February 13, 2026.
Documents Incorporated by Reference
Certain portions of the registrant’s Definitive Proxy Statement for its 2026 Annual Meeting of Stockholders (which is expected to be filed with the Securities and Exchange Commission within 120 days after the end of the registrant’s 2025 fiscal year) are incorporated by reference into Part III of this annual report on Form 10-K.
Except as otherwise specified and unless the context otherwise requires, references to “LP,” the “Company,” “we,” “us,” and “our” refer to Louisiana-Pacific Corporation and its consolidated subsidiaries.
CAUTIONARY STATEMENT REGARDING FORWARD-LOOKING STATEMENTS
Section 27A of the Securities Act of 1933, as amended (the Securities Act), and Section 21E of the Securities Exchange Act of 1934, as amended (the Exchange Act), provide a “safe harbor” for forward-looking statements to encourage companies to provide prospective information about their businesses and other matters as long as those statements are identified as forward-looking and are accompanied by meaningful cautionary statements identifying important factors that could cause actual results to differ materially from those discussed in such forward-looking statements. This annual report on Form 10-K contains, and other reports and documents we file with, or furnish to, the Securities and Exchange Commission (SEC) may contain, forward-looking statements. These statements are based upon the beliefs and assumptions of, and on information currently available to, our management.
The following statements are or may constitute forward-looking statements: statements preceded by, followed by or that include words like “may,” “will,” “could,” “should,” “believe,” “expect,” “anticipate,” “assume,” “intend,” “plan,” “seek,” “estimate,” “project,” “target,” “potential,” “continue,” “likely,” or “future,” as well as similar expressions, or the negative or other variations thereof. Forward-looking statements include other statements regarding matters that are not historical facts including without limitation, plans for product development, forecasts of future costs and expenditures, possible outcomes of legal proceedings, capacity expansion and other growth initiatives, the adequacy of reserves for loss contingencies, and any statements regarding the Company’s financial outlook.
Factors that could cause actual results to differ materially from those expressed or implied by forward-looking statements include, but are not limited to, the following:
•changes in governmental fiscal, trade, and monetary policies, including the imposition of higher or new tariffs, trade barriers, and levels of employment;
•changes in general and global economic conditions, including impacts from rising inflation, supply chain disruptions, new, ongoing, or escalated geopolitical or military conflicts or tensions;
•the commodity nature of a segment of our products and the prices for those products, which are determined in significant part by external factors such as total industry capacity and wider industry cycles affecting supply and demand trends;
•changes in the cost and availability of capital;
•changes in the cost and availability of financing for home mortgages;
•changes in the level of home construction and repair and remodel activity, including as a result of labor shortages;
•changes in competitive conditions and prices for our products;
•changes in the relationship between supply of and demand for building products;
•changes in the financial or business conditions of third-party wholesale distributors and dealers of building products;
•changes in prices and the relationship between the supply of and demand for raw materials, including wood fiber and resins, used in manufacturing our products;
•changes in the cost and availability of energy, primarily natural gas, electricity, and diesel fuel;
•changes in the cost and availability of transportation, including transportation services provided by third parties;
•our dependence on third-party vendors and suppliers for certain goods and services critical to our business;
•operational and financial impacts from manufacturing our products internationally;
•difficulties in the development, launch or production ramp-up of new products;
•our ability to attract and retain qualified executives, management and other key employees;
•the need to formulate and implement effective succession plans from time to time for key members of our management team;
•impacts from public health issues (including global pandemics) on the economy, demand for our products or our operations, including the actions and recommendations of governmental authorities to contain such public health issues;
1
•our ability to identify and successfully complete and integrate acquisitions, divestitures, joint ventures, capital investments and other corporate strategic transactions;
•unplanned interruptions to our manufacturing operations, such as explosions, fires, inclement weather, natural disasters, accidents, equipment failures, labor shortages or disruptions, transportation interruptions, supply interruptions, public health issues (including pandemics and quarantines), riots, civil insurrection or social unrest, looting, protests, strikes, and street demonstrations;
•changes in global or regional climate conditions, the impacts of climate change, and potential government policies adopted in response to such conditions;
•changes in other significant operating expenses;
•changes in currency values and exchange rates between the U.S. dollar and other currencies, particularly the Canadian dollar, Brazilian real, Chilean peso, and Argentine peso;
•changes in, and compliance with, general and industry-specific laws and regulations, including environmental and health and safety laws and regulations, the U.S. Foreign Corrupt Practices Act and anti-bribery laws, laws related to our international business operations, and changes in building codes and standards;
•changes in tax laws and interpretations thereof;
•changes in circumstances giving rise to environmental liabilities or expenditures;
•warranty costs exceeding our warranty reserves;
•challenges to or exploitation of our intellectual property or other proprietary information by our competitors or other third parties;
•the resolution of existing and future product-related litigation, environmental proceedings and remediation efforts, and other legal or environmental proceedings or matters;
•the effect of covenants and events of default contained in our debt instruments;
•the amount and timing of any repurchases of our common stock and the payment of dividends on our common stock, which will depend on market and business conditions and other considerations;
•cybersecurity events affecting our information technology systems or those of our third-party providers and the related costs and impact of any disruption on our business; and
•acts of public authorities, war, political or civil unrest, natural disasters, fire, floods, earthquakes, inclement weather, and other matters beyond our control.
In addition to the foregoing and any risks and uncertainties specifically identified in the text surrounding forward-looking statements, any statements in the reports and other documents filed by us with, or furnished by us to, the SEC that warn of risks or uncertainties associated with future results, events, or circumstances identify important factors that could cause actual results, events, and circumstances to differ materially from those reflected in the forward-looking statements.
The forward-looking statements that we make, or that are made by others on our behalf, are based on our knowledge of our business and our operating environment and assumptions that we believe to be, or will believe to be, reasonable when such forward-looking statements are or will be made. As a consequence of the factors described above, the other risks, uncertainties, and factors we disclose below and in the reports and other documents filed by us with the SEC, other risks not known to us at this time, changes in facts, assumptions not being realized or other circumstances, our actual results may differ materially from those discussed in or implied or contemplated by our forward-looking statements. Consequently, this cautionary statement qualifies all forward-looking statements we make, or that are made on our behalf, including those made herein and incorporated by reference herein. We cannot assure you that the results or developments expected or anticipated by us will be realized or, even if substantially realized, that those results or developments will result in the expected consequences for us or affect us, our business, our operations or our operating results in the manner or to the extent we expect. We caution readers not to place undue reliance on such forward-looking statements, which speak only as of their dates and are inherently uncertain. We undertake no obligation to revise or update any of the forward-looking statements to reflect subsequent events or circumstances except to the extent required by applicable law.
2
ABOUT THIRD-PARTY INFORMATION
In this annual report on Form 10-K, we rely on and refer to information regarding industry data obtained from market research, publicly available information, industry publications, U.S. government sources, and other third parties. Although we believe the information is reliable, we cannot guarantee the accuracy or completeness of the information and have not independently verified it.
3
TABLE OF CONTENTS
| PART I | ||||||||
| Item 1 | ||||||||
| Item 1A | ||||||||
| Item 1B | ||||||||
| Item 1C | ||||||||
| Item 2 | ||||||||
| Item 3 | ||||||||
| Item 4 | ||||||||
| PART II | ||||||||
| Item 5 | ||||||||
| Item 6 | ||||||||
| Item 7 | ||||||||
| Item 7A | ||||||||
| Item 8 | ||||||||
| Item 9 | ||||||||
| Item 9A | ||||||||
| Item 9B | ||||||||
| Item 9C | ||||||||
| PART III | ||||||||
| Item 10* | ||||||||
| Item 11* | ||||||||
| Item 12* | ||||||||
| Item 13* | ||||||||
| Item 14* | ||||||||
| PART IV | ||||||||
| Item 15 | ||||||||
| Item 16 | ||||||||
| * | All or a portion of the referenced section is incorporated by reference from our Definitive Proxy Statement for our 2026 Annual Meeting of Stockholders (which is expected to be filed with the SEC within 120 days after the end of our 2025 fiscal year). | |||||||
4
PART I
ITEM 1. Business
GENERAL
We are a leading provider of high-performance building solutions that meet the demands of builders, remodelers, and homeowners worldwide. Serving the new home construction, repair and remodeling, and outdoor structures markets, we have leveraged our expertise to become an industry leader known for innovation, quality, reliability, and sustainability. The principal customers for our building solutions are retailers, wholesalers, and home building and industrial businesses in North America and South America. Since our founding in 1972, LP has been Building a Better World™ by helping customers construct beautiful, durable homes while shareholders build lasting value. We are headquartered in Nashville, Tennessee, and as of December 31, 2025, we operate more than 20 manufacturing facilities across North and South America.
The table below summarizes net sales in 2025 (dollar amounts in millions):
Net Sales | Percentage of 2025 Net Sales | ||||||||||
| Siding | $ | 1,689 | 62 | % | |||||||
| Oriented Strand Board (OSB) | 832 | 31 | % | ||||||||
| Other | 187 | 7 | % | ||||||||
| $ | 2,708 | ||||||||||
OUR BUSINESS
The Company conducts business through three operating segments: Siding, OSB and LPSA. In the fourth quarter of 2025, the Company determined that LPSA did not meet the reportable segment criteria and beginning with the fourth quarter of 2025, the financial information for the LPSA operating segment is included in Other. These changes had no impact on our consolidated results of operations or financial position. Prior period segment information has been recast to conform to our current presentation. Our other operating segments, Siding and OSB remain reportable operating segments. Other now comprises our South American operations and other products that are not individually significant. See “Note 15 - Segment Information” of the Notes to the Consolidated Financial Statements included in Item 8 of this annual report on Form 10-K for further information regarding our reportable segments.
Siding
We believe we are the largest manufacturer of engineered wood siding in North America. Our Siding business serves diverse end markets with a broad product portfolio of engineered wood siding, trim, soffit, and fascia. Our Siding is offered primed (LP® SmartSide® Trim & Siding, LP BuilderSeries® Lap Siding, and LP® Outdoor Building Solutions®) and pre-finished (LP® SmartSide® ExpertFinish® Trim & Siding) to meet the needs of builders and installers in new construction and repair and remodeling applications. As compared to solid wood, these products offer superior protection against hail, wind, moisture, fungal decay, and termites. The LP SmartSide environmental product declarations (EPDs), which detail the cradle-to-grave energy and materials required to produce LP SmartSide lap, panel, and trim in North America, demonstrate that the products store more carbon than is released during their lifecycles, making them carbon-negative exterior siding products. Our Siding products are used in new home construction, repair and remodeling projects, and outdoor structures such as sheds.
5
We intend to continue growing sales in our Siding business and to increase the breadth of our Siding product offerings. To do so, we plan to increase the production capacity of these high-margin, value-added products. We have several options for increased capacity, including the addition of new plants, conversion of existing OSB plants to Siding manufacturing plants, expansion of existing Siding facilities, and expansion of our prefinished capacity and offerings. We will also seek to drive continued product innovation by utilizing our technological and engineering expertise in wood composites, overlays, chemical treatments, and durable and beautiful paints to better address the needs of our customers.
Oriented Strand Board (OSB)
Developed as a less expensive and more sustainable alternative to plywood, OSB is used as roof decking, sidewall sheathing, and floor underlayment. Our OSB business manufactures and distributes OSB structural panel products, including the innovative value-added OSB product portfolio known as LP® Structural Solutions (which includes LP® FlameBlock® Fire-Rated Sheathing, LP WeatherLogic® Air & Water Barrier, LP® TechShield® Radiant Barrier, LP Legacy® Premium Sub-Flooring, and LP® TopNotch® 350 Durable Sub-Flooring). Our LP Structural Solutions products are engineered to provide a variety of features such as fire resistance, enhanced water and moisture protection, energy efficiency, and greater weight-bearing capacity.
Our focus remains on promoting the benefits of LP Structural Solutions while maintaining strict cost control by (i) the efficiency with which we operate our manufacturing facilities (as measured by a widely used operational metric called Overall Equipment Effectiveness, or OEE), (ii) the efficiency with which we convert sustainably harvested wood fiber into our products, and (iii) our ongoing work to optimize logistics and reduce other costs.
Other
Our other operations include our South American business (LPSA) that manufactures and distributes OSB structural panels and siding products in South America and certain export markets. Additionally, our other operations includes timber and timberlands as well as other minor products, services, and closed operations, which do not qualify as discontinued operations.
OUR BUSINESS STRATEGY
Grow Our Siding Business. We believe that our leadership position in engineered wood siding allows us to benefit from demand growth, particularly as sustainable engineered wood products continue to displace alternative siding materials such as vinyl, fiber cement, and other materials. We have consistently grown our Siding business above the underlying market growth rates, and this business is less sensitive to new housing market cyclicality as over 50% of the demand for our Siding comes from other markets, including off-site structure production and repair and remodeling. We believe that long-term market trends and demographics suggest continued growth in demand for sustainable engineered wood siding in these markets, which we believe we are well-positioned to meet.
Generate Value-Added Sales Growth Through Customer Focus and Innovation. We believe that our products help our customers and end users to mitigate various challenges associated with building and construction activity, including labor shortages, because they are relatively easy to work with and allow for the consolidation of multiple steps into a single product system. Our marketing programs aim to drive awareness of our products and a greater understanding of our products’ specific features among builders, repair and remodel contractors, industrial manufacturers, and major home improvement retailers. Through our sales efforts, we target customers by distribution channel and focus on providing them with a broad array of traditional and specialty building products coupled with quality service. Our facilities are strategically located in the U.S., Canada, Chile, and Brazil to allow us to maintain geographic proximity to our customers and to remain responsive to their changing needs. We prioritize high-quality service and continue to build on our reputation for on-time shipments. In addition, we continually seek to identify new specialty building solutions and markets where we can utilize our core competencies in the design, manufacturing, and marketing of building products.
Focus on Operating Efficiency, Cost Reduction, and Portfolio Optimization. We continue to improve the OEE of our manufacturing facilities. We believe our OEE programs have produced excellent returns and generated many best practices that have been applied across our manufacturing system. Given these initiatives and the strategic locations of many of our facilities, we believe that we are very competitive regarding average delivered cost.
6
As market conditions change, we will continue to adapt our product mix, selectively invest in new technologies that modernize our manufacturing facilities, and manage our capacity to best match customer demand. We believe that these strategies improve our portfolio and margins and enhance the quality and consistency of our earnings.
Pursue Selected Strategic Transactions. We continuously evaluate strategic investments in assets, businesses, and technologies, as well as investments that improve the performance of our businesses. We believe that our pursuit of these opportunities, if successful, could enable us to increase the size and scope of our businesses or joint ventures.
Expand Internationally. We believe that our investments in South America will help us continue to satisfy the growing demand for wood-based residential construction in this region. We believe that investments in this region can continue to be funded by cash generated by our operations in this region. Investments as a market leader in this region should enable us to leverage demand while diversifying both our revenue streams and exposure to market cycles.
OUR MARKETS
Our sales and marketing efforts are primarily focused on traditional distribution, professional building products dealers, home centers, third-party wholesale buying groups, and end users, particularly home builders, industrial manufacturers, and repair and remodel contractors. The wholesale distribution channel includes a variety of specialized and broad-line wholesale distributors and dealers focused primarily on the supply of products for use by professional builders and contractors. The retail distribution channel includes large retail chains catering to the do-it-yourself (DIY) and repair and remodeling markets, as well as smaller independent retailers.
OUR CUSTOMERS
We seek to maintain a broad customer base and a balanced approach to national distribution through both wholesale and retail channels. In 2025, our top ten customers accounted for approximately 47 % of our net sales. Our principal customers include the following:
•Wholesale distribution companies, which supply building materials to retailers on a regional, state, or local basis;
•Distributors, who provide building materials to smaller retailers, contractors, and others;
•Building materials professional dealers that specialize in sales to professional builders, remodeling firms, and trade contractors that are involved in residential home construction and light commercial building; and
•Retail home centers that provide fully manufactured, modular, and panelized structures, for consumer and professional markets.
OUR COMPETITORS / COMPETITION
The building products industry is highly competitive. We primarily compete with other building products firms that offer alternative architectural and structural solutions. Our competitors include both large, diversified producers, and smaller regional manufacturers offering a wide variety of materials and product types. Our specialty products, including our Siding portfolio and LP® Structural Solutions, generally compete based on product features, benefits, quality, sustainability, and availability. Our commodity OSB products generally compete based on price, quality, and availability of products.
OUR MANUFACTURING
We operate manufacturing facilities throughout North America and South America. Our facilities utilize the best available manufacturing techniques based on the needs of our business segments, and we work continuously to improve our operating efficiency and productivity, as measured by OEE. LP operates more than 20 manufacturing facilities across North and South America.
7
STRATEGIC SOURCING
We rely on various suppliers to furnish the raw materials and inputs used in the manufacturing of our products. To maximize our effectiveness in the marketplace, we have a centralized strategic sourcing group that consolidates purchases of certain materials and indirect items across business segments. The goal of the strategic sourcing group is to develop global strategies for a given component group, identify vendors and suppliers that meet our business requirements, promote a competitive pricing environment among our vendors and suppliers, and develop long-term relationships with those vendors and suppliers. By developing these strategies and relationships, we seek to leverage our material needs to implement leading practices, reduce costs, improve process efficiency, improve operating performance, and ensure continuity of supply.
RAW MATERIALS
Wood fiber is the primary raw material used in most of our operations, and the primary source of wood fiber is timber. The primary end-markets for timber harvested in the United States and Canada are manufacturers who supply: (1) the housing market, where timber is used in the construction of new housing and the repair and remodeling of existing housing; (2) the pulp and paper market; (3) commercial and industrial markets; (4) export markets; and (5) emerging biomass energy production markets. The supply of timber can be limited by particular factors that influence the accessibility of timberlands. These factors include policies governing forest management, Indigenous rights-based interests, alternate uses of land, and loss to urban or suburban real estate development. Because wood fiber is subject to commodity pricing, the cost of various types of timber that we purchase in the market has, at times, fluctuated greatly due to weather, government policies and regulations, or economic and other industry conditions. However, our mills are generally located near large and diverse supplies of timber. We source all our wood fiber sustainably, as certified according to the standards of the Sustainable Forestry Initiative® (SFI®) and the Programme for the Endorsement of Forest Certification (PEFC®).
In addition to wood fiber, we use significant quantities of various resins in our manufacturing processes. Resin product costs are influenced by changes in the prices of raw materials used to produce resin, primarily petroleum products and energy, as well as competing demand for resin products. Currently, we purchase most of our resin from five major suppliers. However, there can be no assurance that pricing or availability of resins will not be impacted by competing demand or supply chain disruptions due to significant weather or other uncontrollable events.
While a significant portion of the energy requirements of our plants are met by the energy produced from the conversion of wood waste, we also purchase electricity and natural gas. Energy prices have experienced significant volatility in recent years, particularly in deregulated markets. We attempt to mitigate our exposure to energy price changes through the selective use of long-term supply agreements.
SEASONALITY
Our business is subject to seasonal variances, with demand for many of our products tending to be higher during the building season, which generally occurs in the second and third calendar quarters in North America and the first and fourth calendar quarters in South America.
GOVERNMENT REGULATION
Our operations are subject to the laws and regulations of the United States and multiple foreign jurisdictions. These laws and regulations, which differ among jurisdictions and are subject to change, include those related to financial and other disclosures, accounting standards, corporate governance, environmental policy, intellectual property, tax, trade, antitrust, labor and employment, immigration and travel, privacy, and anti-corruption, among others. Additional information concerning legal and regulatory matters is set forth under “Risk Factors – Legal and Regulatory Risk Factors” in Item 1A of this annual report on Form 10-K.
8
We are subject to income taxes and other corporate taxes in the United States and multiple foreign jurisdictions. Our provision for income taxes and our effective tax rate could be affected by numerous factors, including changes in applicable tax laws, interpretations of applicable tax laws, the amount and composition of pre-tax income in jurisdictions with differing tax rates, and the valuation of deferred tax assets. Additional information concerning tax matters is set forth under “Risk Factors – Legal and Regulatory Risk Factors - Regulatory and statutory changes applicable to us or our customers, including changes in effective tax rates or tax law, could adversely affect our financial condition and results of operations” in Item 1A of this annual report on Form 10-K, and in “Note 6 - Income Taxes” of the Notes to the Consolidated Financial Statements included in Item 8 of this annual report on Form 10-K.
Our operations are also subject to many environmental laws and regulations governing, among other things, the discharge of pollutants and other emissions on or into the land, water, and air, the disposal of hazardous substances or other contaminants, the remediation of contamination, and the restoration and reforestation of timberlands. In addition, certain environmental laws and regulations impose liability and responsibility on present and former owners, operators, or users of facilities and sites for contamination at such facilities and sites without regard to causation or knowledge of contamination. Compliance with environmental laws and regulations may significantly increase the costs of our operations. In some cases, plant closures could invoke more rigorous compliance requirements. Violations of environmental laws and regulations could subject us to additional costs and expenses, including defense costs and expenses and civil and criminal penalties. We cannot guarantee that the environmental laws and regulations to which we are subject will not become more stringent or be more stringently implemented or enforced in the future.
Changes in global or regional climate conditions and current or future governmental responses to such changes at the international level and U.S. federal and state levels, such as regulating and/or taxing the production of carbon dioxide and other greenhouse gases to facilitate the reduction of emissions into the atmosphere, requiring certain entities to disclose details about the emissions of greenhouse gases and/or the imposition of taxes or other incentives to produce and use “cleaner” energy, may increase energy costs, limit timber harvest levels, increase costs associated with disclosure related to greenhouse gases and impact our operations or our planned or future growth. Because our manufacturing operations depend on significant amounts of energy and raw materials, these initiatives could have an adverse impact on our operations and profitability. Future legislation or regulatory activity in this area remains uncertain, as does the potential impact on our business and operations.
We are committed to complying with all applicable environmental laws and regulations and intend to continue devoting significant management attention to such matters. In addition, we occasionally undertake construction projects for environmental control equipment or incur other environmental costs that extend an asset’s useful life, improve its efficiency, and/or improve the property’s marketability.
Additional information concerning environmental matters is set forth under Item 3 “Legal Proceedings”, and in “Note 12 - Commitments and Contingencies” of the Notes to the Consolidated Financial Statements included in Item 8 of this annual report on Form 10-K.
WORKFORCE AND EMPLOYEE RELATIONS
Our employees are our most important asset, and they are integral to our ability to achieve our strategic objectives. The continued success and growth of our business depends, in large part, on our ability to attract, retain, and develop a diverse population of talented and high-performing employees at all levels. We have developed key recruitment and retention strategies, objectives, and measures that we focus on as part of the overall management of LP, which will continue to support our efforts to succeed in a competitive labor market. These strategies, objectives, and measures are the basis of our workforce management framework and are advanced through the following programs, policies, and initiatives:
Workforce & Labor Relations. As of December 31, 2025, we employed approximately 4,300 employees, comprising approximately 2,800 in the United States, 800 in Canada, and 800 in South America. Approximately 3,500 employees were employed at manufacturing facilities, and approximately 1,200 employees were subject to collective bargaining agreements and/or national trade union agreements. We are committed to working collaboratively with the unions that represent some of our employees.
9
Health, Safety, and Wellness. We are committed to the health, safety, and wellness of our employees. Safety is a core value at LP. We safeguard our people, projects, and reputation by maintaining a safety culture that strives to reduce risks to our employees. Our innovative safety and health processes are at the forefront of everything we do. We provide our employees, contractors, and guests with ongoing safety training to ensure that safety policies and procedures are effectively communicated, implemented, and followed. We also aim to start every meeting, every mill tour, and every morning at our manufacturing facilities with a message about safety. The success of our business is fundamentally connected to the safety and well-being of our people.
LP is committed to continual improvement of our health and safety performance. We establish internal annual targets and seek continual safety performance improvements every year. One of the metrics that we carefully track is Total Incident Rate (TIR), a common industry measure of recordable incidents per 100 employees. We have established a targeted TIR of <1.0 per year, which we believe represents industry-leading performance, and for the year ended December 31, 2025, actual TIR of 0.62 was better than our target. To further enhance our commitment to safety, we have also implemented a Serious Injury and Fatality (SIF) Prevention program and the tracking of Weighted Incident Rate (WIR). The SIF Prevention program is a proactive approach to address the most significant exposures our employees face on the job. The WIR metric reflects the severity of incidents to monitor our safety performance. The SIF Prevention program and the tracking of WIR enhance hazard recognition and employee engagement and drive our teams to evaluate controls to ensure we are incorporating improved levels of protection whenever possible. We use this data to prioritize, manage, and carefully track safety performance at all our facilities and integrate sound safety practices to make a meaningful difference in every facet of our operations.
Inclusion and Belonging. We value the diverse backgrounds, experiences, and perspectives of our employees, customers, and stakeholders, and are committed to fostering an environment where everyone feels a strong sense of belonging. This sense of belonging strengthens our ability to attract, develop, and retain top talent at all levels.
Talent and Development. We are committed to hiring exceptional talent and providing resources that support continuous career growth. We begin with talented individuals who join for a role and stay for long, rewarding careers because we invest in their development, listen to their feedback, and respond to their concerns.
Our talent development programs provide employees with the resources they need to help achieve their career goals, build management skills, and lead the Company.
Compensation and Benefits. We strive to provide competitive compensation and benefits programs to help meet the needs of our employees and offer the flexibility, inclusivity, choice and protection necessary to retain top talent.
While subject to change, our current benefit programs may include, depending on country/region and employment position, stock-based awards granted pursuant to our stock award plans, awards granted under our annual cash incentive award plan, an employee stock purchase plan, a 401(k) and profit-sharing plan or defined contribution plan, healthcare and insurance benefits, health savings and flexible spending accounts, paid time off, family medical leave, paid parental leave (maternity, bonding, adoption, and surrogacy), fertility benefits, an employee emergency support fund, tuition assistance, and scholarship programs.
We also provide our employees and their families with access to a variety of innovative, flexible, and convenient health and wellness programs. These benefits provide protection and security so employees can have peace of mind concerning events that may impact their financial well-being. In addition, we offer employees the ability to customize benefits options to meet their individual needs and the needs of their families.
Our executive management team provides oversight of our programs, policies, and initiatives focusing on workforce inclusion and belonging, talent and development, and compensation and benefits. It is our policy to fully comply with all laws (domestic and foreign) applicable to equal employment opportunity and discrimination in the workplace.
10
SEGMENT AND PRICE TREND DATA
The following tables present summary data for each of the last three years relating to: (i) housing starts within the United States, (ii) our sales volumes, and (iii) our OEE performance. We consider the following items to be key performance indicators for our business because LP’s management uses these metrics to evaluate our business and trends in our industry, measure our performance, and make strategic decisions. We believe that the key performance indicators presented may provide additional perspective and insights when analyzing our core operating performance. These key performance indicators should not be considered superior to, as a substitute for, or as an alternative to, and should be considered in conjunction with the financial measures that were prepared in accordance with accounting principles generally accepted in the United States of America (U.S. GAAP). These measures may not be comparable to similarly titled performance indicators used by other companies.
In addition, information concerning our: (i) profit by segment; (ii) capital expenditures by segment; (iii) identifiable assets by segment; (iv) goodwill by segment; and (v) geographic area information, is included in “Note 15 - Segment Information” of the Notes to the Consolidated Financial Statements included in Item 8 of this annual report on Form 10-K.
Housing Starts
We monitor housing starts, which is an indicator of residential construction in the United States that correlates with the demand for many of our products. We believe that this is a useful measure for evaluating our results and that providing this measure should allow interested persons to more readily compare our sales volume for past and future periods to an external indicator of product demand. Other companies may present housing start data differently, and therefore, as presented by us, our housing start data may not be comparable to similarly titled indicators reported by other companies.
The following table sets forth U.S. housing starts data reported by the U.S. Census Bureau for the quarter and year ended December 31, 2025, 2024, and 2023 (amounts based upon information published through January 9, 2026, in thousands):
| Year Ended December 31, | |||||||||||||||||
20251 | 2024 | 2023 | |||||||||||||||
Housing starts: | |||||||||||||||||
| Single-Family | 949 | 1,013 | 948 | ||||||||||||||
| Multi-Family | 416 | 354 | 472 | ||||||||||||||
| 1,364 | 1,367 | 1,420 | |||||||||||||||
1November and December 2025 housing starts have not yet been published by the U.S. Census Bureau, and therefore, we have used October 2025 housing starts as the November and December 2025 actual housing starts.
Sales Volume Information Summary
We monitor sales volumes for our products in our Siding and OSB segments, which we define as the amount of our products sold within the applicable period measured in million square feet (MMSF) on a standard 3/8" thickness basis. Evaluating sales volume by product type helps us identify and address changes in product demand, broad market factors that may affect our performance, and opportunities for future growth. It should be noted that other companies may present sales volume data differently, and therefore, as presented by us, sales volume data may not be comparable to similarly titled measures reported by other companies. We believe that sales volumes can be a useful measure for evaluating and understanding our business.
11
The following table sets forth sales volumes for the year ended December 31, 2025 and 2024 (in MMSF):
Year Ended December 31, | |||||||||||||||||
| 2025 | 2024 | 2023 | |||||||||||||||
| Siding | 1,786 | 1,719 | 1,547 | ||||||||||||||
| Total Siding sales volume | 1,786 | 1,719 | 1,547 | ||||||||||||||
| OSB - Structural Solutions | 1,535 | 1,705 | 1,559 | ||||||||||||||
| OSB - Commodity | 1,540 | 1,680 | 1,512 | ||||||||||||||
| Total OSB sales volume | 3,075 | 3,384 | 3,071 | ||||||||||||||
Overall Equipment Effectiveness Summary
We measure OEE of each of our mills to track improvements in the utilization and productivity of our manufacturing assets. OEE is a composite metric that considers asset uptime (adjusted for capital project downtime and similar events), production rates, and finished product quality. We believe that when used in conjunction with other metrics, OEE can be a useful measure for evaluating our ability to generate profits, and that providing this measure should allow interested persons to monitor operational improvements. We use a best-in-class target across all LP sites that allows us to optimize capital investments, focus maintenance and reliability improvements, and improve overall equipment efficiency. It should be noted that other companies may present OEE data differently, and therefore, as presented by us, OEE data may not be comparable to similarly titled measures reported by other companies.
OEE for the year ended December 31, 2025 and 2024 for each of our businesses is listed below:
Year Ended December 31, | |||||||||||||||||
| 2025 | 2024 | 2023 | |||||||||||||||
| Siding | 77 | % | 77 | % | 77 | % | |||||||||||
| OSB | 79 | % | 78 | % | 75 | % | |||||||||||
AVAILABLE INFORMATION
We file annual reports on Form 10-K, quarterly reports on Form 10-Q, current reports on Form 8-K, proxy statements, and from time to time, other documents with the SEC. Our SEC filings are available to the public over the Internet at the SEC’s website at http://www.sec.gov.
In addition, we will make available our annual reports on Form 10-K, quarterly reports on Form 10-Q, current reports on Form 8-K, and amendments to those reports filed or furnished pursuant to Section 13(a) or 15(d) of the Exchange Act through our Internet website at http://investor.lpcorp.com under the “SEC Filings” heading of the “Financial Information” tab as soon as reasonably practicable after we electronically file such material with, or furnish it to, the SEC. Information contained on, or accessible through, our website is not a part of, and is not incorporated by reference into, this annual report on Form 10-K.
12
ITEM 1A. Risk Factors
You should be aware that the occurrence of any of the events described in this Risk Factors section and elsewhere in this annual report on Form 10-K or in any other of our filings with the SEC could have a material adverse effect on our business, financial position, results of operations and cash flows. In evaluating us, you should consider carefully, among other things, the risks described below and the matters described in “Cautionary Statement Regarding Forward-Looking Statements.”
BUSINESS AND OPERATIONAL RISK FACTORS
Unplanned events may interrupt our manufacturing operations, which may adversely affect our business. The manufacturing of our products is subject to unplanned events such as explosions, fires, inclement weather, natural disasters, accidents, equipment failures, or labor disruptions that may be caused by, among other factors, changes in immigration policy, transportation interruptions, supply interruptions, public health issues (including pandemics and quarantines), riots, civil insurrection or social unrest, looting, protests, strikes, and street demonstrations. During the year ended December 31, 2025, fire interruptions reduced production by less than 1%, but future fire or other operational interruptions could significantly curtail the production capacity of a facility for a period of time. We have redundant capacity and capability to produce many of our products within our manufacturing platform to mitigate our business risk from such interruptions, but major or prolonged interruptions could compromise our ability to meet our customers’ needs. Delayed delivery of our products to customers who require on-time delivery from us may cause customers to purchase alternative products at a higher cost, reschedule their own production, or incur other incremental costs. Customers may be able to pursue financial claims against us for their incremental costs, and we may incur costs to correct such problems in addition to any liability resulting from such claims. Interruptions may also harm our reputation among actual and potential customers, potentially resulting in a loss of business. To the extent these losses are not covered by insurance, our financial position, results of operations, and cash flows could be adversely affected by such events.
We mostly depend on third parties for transportation services and increases in costs or changes in the availability of transportation could materially and adversely affect our business and operations. Our business depends on the transportation of many products, both domestically and internationally. We rely primarily on third parties for transportation of the products we manufacture and/or distribute as well as for delivery of our raw materials. In particular, a significant portion of the goods we manufacture and raw materials we use are transported by railroad or trucks, which are highly regulated. There may be labor unrest or disputes, including strikes and work stoppages, among workers at various transportation providers and in industries affecting the transportation industry, including those that are unionized, like the railroad industry. If any of our third-party transportation providers were to fail to deliver the goods we manufacture or distribute in a timely manner, or fail to deliver raw materials to us in a timely manner, it could impact our ability to manufacture and deliver our products, or to sell those products at full value or at all. In addition, if any of these third parties were to cease operations or cease doing business with us, we may be unable to replace them at a reasonable cost. Any failure of a third-party transportation provider to deliver raw materials or finished products in a timely manner could harm our reputation, impact our ability to manufacture and deliver our products, negatively affect our customer relationships and have a material adverse effect on our financial condition and results of operations. Further, an increase in transportation rates and oil and/or fuel surcharges could materially and adversely affect financial results, including profitability.
13
Our reliance on third-party wholesale distribution channels could impact our business. We offer our products directly and through a variety of third-party wholesale distributors and dealers. Adverse changes in the financial or business condition of these wholesale distributors and dealers or our customers, including as a result of the impacts arising from tariffs, geopolitical conflicts, supply chain disruptions, or inflation, could subject us to losses and affect our ability to bring our products to market. One or more of our customers may experience financial difficulty, file for bankruptcy protection, or go out of business as a result of general market conditions or various other events, which could result in an increase in customer financial difficulties that affect us. The direct impact on us could include reduced revenues and write-offs of accounts receivable and could negatively impact our cash flow. While we currently cannot estimate what those effects will be, if they are severe, the indirect impact could include impairments of intangible assets and reduced liquidity, among others. Any such adverse changes could have a material adverse effect on our business, financial position, liquidity, results of operations, and cash flows. Further, our ability to effectively manage inventory levels at wholesale distributor locations may be impaired as a result of adverse changes in the financial or business condition of such wholesale distributors, which could increase expenses associated with excess and obsolete inventory and negatively impact our cash flows.
We may experience difficulties in the development, launch or production ramp-up of new products, which could adversely affect our business. Our continued success depends in part on our ability to develop new products that will meet the demands of our customers. We may not be successful in developing new products on an effective and financially profitable basis. Additionally, as we ramp up manufacturing processes for newly introduced products, we may experience difficulties, including manufacturing disruptions, delays, or other complications, which could adversely impact our ability to serve our customers, our reputation, our costs of production, and, ultimately, our financial position, results of operations and cash flows.
We may be unable to attract and retain qualified executives, management and other key employees. Our success depends in part on our ability to attract and retain employees with the skills necessary to operate and maintain our facilities, produce our products, and serve our customers. Our key executives and management employees are important to our business and could be difficult to replace because they have extensive experience and skills relevant to our industry and business operations. In addition, the competition for skilled manufacturing, engineering, sales and other personnel, both hourly and salaried, may be intense in the regions where we operate. Our failure to hire and retain employees capable of performing at a high level, to successfully implement succession plans for executives and management employees, or to implement effective training plans for new personnel could jeopardize our ability to grow our business and could adversely impact our financial position, results of operations and cash flows.
Cybersecurity risks related to the technology used in our operations and other business processes, as well as security breaches of Company, customer, consumer, employee, or vendor information, could adversely affect our business. We rely on various information technology systems to capture, process, store, and report data and interact with customers, consumers, employees, and vendors. Despite careful security and controls design, implementation, updating, and internal and independent third-party assessments, our information technology systems, and those of our third-party providers, could become subject to security breaches, cyber-attacks, ransomware attacks, employee misconduct, computer viruses, unauthorized access attempts, phishing, social engineering, misplaced or lost data, programming and/or human errors or other similar events. Network, system, and data breaches could result in misappropriation of trade secrets or sensitive data or operational disruptions, including interruption to systems availability and denial of access to, and misuse of, applications required by our customers and vendors to conduct business with us. In addition, hardware and operating system software and applications that we procure from third parties may contain defects in design or manufacture, including “bugs” and other problems that could unexpectedly interfere with the operation of the systems. Misuse of internal applications, theft of intellectual property, trade secrets, or other corporate assets, and inappropriate disclosure of confidential information could stem from such incidents. A cybersecurity breach could result in manipulation and destruction of sensitive data, cause critical systems to malfunction, be damaged or shut down, and lead to disruption to our operations and production downtimes, potentially for lengthy periods. Theft of personal or other confidential data and sensitive proprietary information could also occur as a result of a cybersecurity breach, exposing us to costs and liabilities associated with privacy and data security laws in the jurisdictions in which we operate.
14
While we have security measures in place that are designed to protect customer and other sensitive information and the integrity of our information technology systems and prevent data loss and other security breaches, our security measures or those of our third-party service providers may not be sufficiently broad in scope to protect all relevant information, may not function as planned, or may be breached as a result of third-party action, employee or vendor error, malfeasance, or otherwise. While we maintain cybersecurity insurance, the costs related to cybersecurity threats or disruptions may not be fully insured. Because the techniques used to obtain unauthorized access, disable or degrade service, or sabotage systems change frequently or may be designed to remain dormant until a predetermined triggering event and often are not recognized until launched against a target, we may be unable to anticipate these techniques or implement sufficient control measures to defend against these techniques. The rapid evolution and increased adoption of generative artificial intelligence (AI) is further increasing risks in this area, including by making cyberattacks more difficult to detect, contain or mitigate and making fraud detection more difficult, particularly with detection devices that use voice recognition or authentication. Once a security incident is identified, we may be unable to fully remediate or otherwise respond to such an incident in a timely manner, which may cause us to incur remediation or other costs or subject us to demands to pay a ransom fee. Additionally, a breach could expose us and our customers, consumers, vendors, and employees to risks of misuse of such information. Such negative consequences of cyberattacks, cybersecurity failures or other security breaches could impact our ability to operate our businesses effectively, adversely affect our reputation, competitive position, business or financial results, and expose us to potential liability, litigation, governmental inquiries, investigations or regulatory enforcement actions. In addition, the lost profits and increased costs related to cybersecurity or other security threats or disruptions may not be fully insured against or indemnified by other means. As a result, cybersecurity and the continued development and enhancement of our controls, processes, and practices remain a priority for us. We may be required to expend additional resources to continue to enhance our security measures necessary to investigate and remediate any security vulnerabilities. We cannot predict the degree of any impact that increased monitoring, assessing, or reporting of cybersecurity matters would have on operations, financial conditions and results.
From time to time, we may implement new technology systems or replace and/or upgrade our current information technology systems. These upgrades or replacements may not improve our productivity to the levels anticipated and may subject us to inherent costs and risks associated with implementing, replacing, and updating these systems, including potential disruption of our internal control structure, substantial capital expenditures, demands on management time and other risks of delays or difficulties in transitioning to new systems or of integrating new systems into other existing systems. Our development, integration and use of AI technology in our operations remains in the early phases. Although we aim to implement AI technology according to responsible procedures and adequate safeguards, our current or future use of AI or machine learning tools in our business operations could expose us to new or additional costs and risks, including the potential introduction of new vulnerabilities or cybersecurity risks within our information technology systems; the potential inadvertent or unauthorized release of our confidential or proprietary information resulting from the use (whether or not authorized) of AI or machine learning tools by our employees, contractors, agents, representatives, vendors or customers; the potential loss of our intellectual property or our potential infringement of the intellectual property rights of third parties resulting from the use (whether or not authorized) of AI or machine learning tools in our operations; and potential legal or reputational harms due to insufficient or flawed data, inaccurate or misleading outputs, insufficient quality control, or unlawful bias or discrimination associated with the use of AI or machine learning tools. In addition, the AI tools we may incorporate into certain aspects of our operations may not generate the intended efficiencies and may impact our business results. Our inability to prevent information technology system disruptions or to mitigate the impact of such disruptions could have an adverse effect on our business.
15
Because our intellectual property and other proprietary information may become compromised, we are subject to the risk that competitors could copy our products or processes. Our success depends, in part, on the proprietary nature of our technology, including non-patentable intellectual property, such as our process technology. To the extent that a competitor can reproduce or otherwise capitalize on our technology, it may be difficult, expensive, or impossible for us to obtain adequate legal remedies or other recourse. Also, the laws of some foreign countries may not protect our intellectual property to the same extent as do the laws of the United States. In addition to patent protection of intellectual property rights, we consider elements of our product designs and processes to be proprietary and confidential, and/or trade secrets. To safeguard our confidential information, we rely on employee, consultant, and vendor nondisclosure agreements and contractual provisions and a system of internal and technical safeguards. However, any of our registered or unregistered intellectual property rights may be subject to challenge or possibly exploited by our competitors or other third parties, which could materially adversely affect our financial position, results of operations, cash flows, and competitive position.
We manufacture and distribute our products in jurisdictions outside the United States and are exposed to risks associated with international business operations, including risks related to potential supply chain disruptions, such as delays, cost fluctuations, and challenges in sourcing materials or components due to geopolitical events, government trade policies, or logistical constraints. We manufacture our products in the United States, Canada, Chile, and Brazil and sell our products primarily in North America and South America. We operate a supply chain that involves the shipment of goods from certain international markets to the jurisdictions where we manufacture our products. Accordingly, we are subject to risks associated with potential disruption caused by changes in political, monetary, economic, and social environments, including civil and political unrest, terrorism, possible expropriation, local labor conditions (including labor disruptions or shortages), changes in laws, regulations, and policies of foreign governments and trade disputes with the United States (including tariffs), and compliance with U.S. laws affecting activities of U.S. companies abroad, including tax laws, economic sanctions and enforcement of contract and intellectual property rights. Steps taken by the U.S. government to apply new, or increase existing, tariffs on certain products and materials imported into the U.S. could potentially disrupt our existing supply chains and have imposed, and could continue to impose, additional costs on our business, including costs with respect to raw materials upon which our business depends. Additionally, potential tariffs imposed by other countries in response to U.S. trade policies could adversely affect our ability to export products from the United States to key international markets, leading to decreased sales and profitability. Such retaliatory tariffs could also increase the cost of certain components and materials that we import into the U.S., further straining our supply chain and impacting our overall financial performance.
Our international operations and sourcing of materials could be harmed by a variety of factors, including:
•recessionary trends in international markets;
•legal and regulatory changes and the burdens and costs of our compliance with a variety of laws, including but not limited to export controls, import and customs trade restrictions, tariffs, and regulations related to public health matters;
•increases in transportation costs or transportation delays;
•work stoppages, unionization efforts and labor strikes;
•fluctuations in currency exchange rates, particularly the value of the U.S. dollar relative to other currencies; and
•social and political unrest, geopolitical and military conflicts or tensions, terrorism and economic instability.
If any of these or other factors were to render the conduct of our business in a particular country undesirable or impractical, our business, financial condition, or results of operations could be materially adversely affected.
16
In 2025, the U.S. government announced significant changes to U.S. trade policy, including the implementation or planned imposition of new or increased tariffs and trade barriers on a broad range of goods imported from international markets, as well as the potential modification or termination of existing trade agreements between the U.S. and certain other countries. In response, certain countries have imposed, or are considering, retaliatory tariffs on U.S. exports. Changing trade policy in the U.S. and other countries could continue to increase the cost of certain raw materials or components that are critical to our manufacturing process, which could have a material negative impact on our manufacturing costs and our overall financial performance. For the year ended December 31, 2025, we incurred $8 million in expenses related to new or increased tariffs. While we do not consider the impact on our 2025 financial results to be material, and impact from increased tariffs are not currently expected to be material in 2026, given the rapid changes and growing uncertainty relating to the global tariff landscape, the potential impact of these factors on our future operational and financial performance is uncertain and our sales and our competitive position within the U.S. market and in markets outside the U.S. could be negatively impacted.
We may pursue acquisitions, divestitures, joint ventures, capital investments and other corporate strategic transactions from time to time. These transactions may involve risks or may not be successful. Our business strategy may depend, in part, on our ability to accomplish successful acquisitions, divestitures, joint ventures, capital investments and other corporate strategic transactions that we may pursue. The benefits we typically expect to achieve from such corporate strategic transactions may include, among other things, synergies, cost savings, growth opportunities and access to new markets, and in the case of divestitures, the disposition of businesses or assets that do not align with our long-term strategy and the realization of proceeds from the sale of businesses and assets to unrelated purchasers. We are subject to the risk that we may not achieve the expected benefits associated with such transactions. Failure to achieve such benefits could have a material adverse impact on our financial position, operating results and cash flows.
Additionally, corporate strategic transactions that we may pursue may involve a number of special risks, including, among other things, the diversion of management attention and business resources in connection with the pursuit of such transactions and the integration of acquired assets or businesses into our operations, the demands on our financial, operational and information technology systems resulting from the acquisition of assets or businesses, and the possibility that we may become responsible for unexpected liabilities resulting from an acquisition for which we may not be adequately indemnified. These and other risks associated with corporate strategic transactions we may pursue may be unpredictable and beyond our control and could have a material adverse impact on our financial position, reputation, operating results and cash flows.
The impact of new ongoing or escalated military and geopolitical conflicts and tensions on the global economy, energy supplies and raw materials may prove to negatively impact our business and operations. Our business could be negatively affected by the impact of new or ongoing military or geopolitical conflicts on international markets and the global economy. The impact of ongoing conflicts and/or escalation thereof could include increased volatility in financial and commodity markets, increased energy prices, increased maritime shipping costs, supply chain disruptions, a higher level of general market and macroeconomic instability, increased cyber attacks and violent protests or political or social unrest in areas outside the immediate conflict area, among other things. These conflicts and tensions and other military or geopolitical conflicts or tensions that may arise in the future could materially adversely affect our operations, financial position, and results.
We are subject to physical, operational, transitional, and financial risks associated with climate change and global, regional, and local weather conditions, and with legal, regulatory, and market responses to climate change. There has been an evolving focus, including from investors, the general public, and U.S. and foreign governmental and nongovernmental authorities, regarding sustainability matters, including with respect to climate change, greenhouse gas emissions, packaging and waste, sustainable supply chain practices, deforestation, and land, energy, and water use. We cannot predict whether our disclosures or performance will be considered satisfactory or the extent to which a change in monitoring, assessing, or reporting of sustainability may impact our operations, financing condition, and results.
17
The unpredictability and frequency of natural disasters such as hurricanes, earthquakes, hailstorms, wildfires, snow, ice storms, the spread of disease, and insect infestations could affect the supply of raw materials or cause variations in their costs, or variations in transportation-related costs. In addition, global climate change may increase the frequency or intensity of extreme weather events, such as storms, floods, heat waves, and other events that could affect our facilities and demand for our products.
Our suppliers and the third parties we rely on for transportation may also be impacted by evolving sustainability reporting requirements or risks associated with the transition to a lower carbon economy, which may adversely impact their ability to provide us with goods and services and we may be unable to meet consumer demands at the same cost or in a timely fashion.
Our reputation may be adversely affected if we are not able to achieve our sustainability and corporate responsibility priorities or otherwise meet the expectations of our stakeholders with respect to these matters. We strive to deliver shared value through our business. From time to time, we announce certain aspirations and priorities relevant to these matters and publish information about our sustainability and corporate responsibility priorities, strategies, and progress on our corporate website, our sustainability report and in public filings (none of which are incorporated by reference into and do not form any part of this annual report on Form 10-K or our other filings with the SEC unless expressly incorporated by reference). Achievement of these priorities and strategies is subject to risks and uncertainties, many of which are outside of our control, and it is possible that we may not achieve all our priorities or certain of our stakeholders might not be satisfied with our efforts regarding these matters. Perceived failures or delays in meeting our sustainability and corporate responsibility priorities could adversely affect public perception of our business, employee morale or customer or stakeholder support, and may negatively impact our financial condition and results of operations.
Stakeholder expectations regarding sustainability practices are diverse, rapidly changing, and may impact reporting requirements, voluntary disclosures, and the setting of goals and commitments. Developing, sharing and acting on sustainability initiatives, and collecting, measuring, and reporting related data, can be costly, difficult, and time-consuming. Any failure or perceived failure by us in this regard could adversely impact our business and reputation.
INDUSTRY RISK FACTORS
Our business primarily relies on North American new home construction and repair and remodeling, which are impacted by risks associated with fluctuations in the housing market. Downward changes in the general economy, the housing market, or other business conditions could adversely affect our results of operations, cash flows, and financial condition. The housing market is sensitive to changes in economic conditions and other factors, such as the level of employment, access to labor, consumer confidence, consumer income, availability of financing, prevailing interest rates and the cost of home mortgage financing, inflation levels, and growth of the gross domestic products in the countries in which we operate.
Adverse changes in any of these conditions generally, or in any of the markets where we operate, could decrease demand for our products and could adversely impact our businesses by: causing consumers to delay or decrease homeownership or relocation; making consumers more price-conscious, resulting in a shift in demand to smaller or less expensive homes; making consumers more reluctant to make investments in their existing homes; or making it more challenging to secure loans for major renovations or new home construction. Unfavorable changes in demographics, credit markets, consumer confidence, household incomes, inflation, housing affordability, or housing inventory levels and occupancy rates, or a weakening of the U.S. economy or of any regional or local economy in which we operate, could adversely affect consumer spending, result in decreased demand for our products, and adversely affect our business. If conditions in the overall housing market or in a specific market or submarket worsen in the future beyond our current expectations, such changes could continue to have a material adverse effect on our financial position, results of operations, and cash flows. Additionally, higher interest rates, higher levels of unemployment, restrictive lending practices, heightened regulation, and increased foreclosures could have a material adverse effect on our financial position, results of operations, and cash flows.
18
We have a high degree of product concentration in OSB, which is subject to commodity pricing and associated price volatility. OSB accounted for about 33% of our North American net sales in 2025 and 43% in each of 2024 and 2023. We expect OSB sales to continue to account for a substantial portion of our revenues and profits in the future. The concentration of our business in the OSB market increases our sensitivity to commodity pricing and price volatility. Historical prices for our commodity products have been volatile, and we, like other participants in the building products industry, have limited influence over the timing and extent of price changes for our commodity products. Commodity product pricing is significantly affected by the relationship between supply and demand in the building products industry. Product supply is influenced primarily by fluctuations in available manufacturing capacity. Demand is affected by the state of the economy in general and a variety of other factors, including the level of new residential construction activity, home repair and remodeling activity, and changes in the availability and cost of mortgage financing. In this competitive environment, with many variables beyond our control, we cannot guarantee that pricing for our OSB products will not decline from current levels. Decreases in pricing for OSB products may have a material adverse effect on our financial position, liquidity, results of operations, and cash flows. The continued development of builder and consumer preference for our OSB products (commodity and LP® Structural Solutions) over competitive products is critical to sustaining and expanding demand for our products. Therefore, a failure to maintain and increase builder and consumer acceptance of our OSB products could also have a material adverse effect on our financial position, liquidity, results of operations, and cash flows.
Intense competition in the building products industry could prevent us from increasing or sustaining our net sales and profitability. The markets for our products are highly competitive. Our competitors range from very large, fully integrated forest and building products firms to smaller firms that may manufacture only one or a few types of products. Many of our competitors may have greater financial and other resources, greater product diversity, and better access to raw materials than we do, and certain of the mills operated by our competitors may be lower-cost producers than the mills we operate. Increased competition in any of the markets in which we operate would likely cause heightened pricing pressures in those markets. Any of these factors could have a material adverse effect on our financial position, results of operations, and cash flows.
Our results of operations may be adversely affected by potential shortages of raw materials and increases in raw material costs. We purchase various raw materials, including, among others, wood, wood-based, and resin products, which are subject to price fluctuations that could materially increase our manufacturing costs. Further, some of our suppliers have consolidated and other suppliers may do so in the future. Combined with increased demand, such consolidation could increase the price of our supplies and raw materials. The most significant raw material used in our operations is wood fiber. Wood fiber is subject to commodity pricing, which fluctuates based on market factors over which we have no control. In addition, the cost of various types of wood fiber that we purchase in the market has at times fluctuated greatly because of governmental, economic, or industry conditions and may be affected by increased demand resulting from initiatives to increase the use of biomass materials in the production of heat, power, bio-based products, and biofuels. Wood fiber supply could also be influenced by natural events, such as forest fires, ice storms, wind storms, hurricanes, and other severe weather conditions, insect epidemics, plant and tree disease, changing temperature and precipitation patterns, and other natural disasters and man-made causes, which may increase wood fiber costs, restrict access to wood fiber, or force production curtailments. In addition to wood fiber, we also use a significant quantity of various resins in our manufacturing processes. Resin product costs are influenced by changes in the prices or availability of raw materials used to produce resins, primarily petroleum products, as well as demand for and availability of resin products and their chemical precursors. OSB product prices are largely driven by the ratio of overall OSB demand to industry capacity. We are unable to determine to what extent, if any, we will be able to pass any future OSB raw material cost increases through to our customers through product price increases. Furthermore, supply disruptions in resin or wood fiber may impact our ability to produce our products or may cause production costs to increase. Our inability or unwillingness to pass increased costs through to our customers could have a material adverse effect on our financial condition, results of operations, and cash flows.
Development of Canadian provincial forest lands, from which we obtain wood fiber, can be subject to constitutionally protected Indigenous treaty, Aboriginal title, or Aboriginal rights of recognized Indigenous groups in Canada. Provincial governments are required by law to consult with Indigenous nations regarding land use development projects, including forest management plans and operations permits.
19
Canadian provincial governments are actively engaged in consultations or negotiations with Indigenous groups. Negotiations sometimes progress slowly and may be subject to litigation if rights-based interests are not fully addressed. In addition, it can take time for Canadian provincial governments to consult with Indigenous groups, and this too can be subject to litigation. To offset this risk, we proactively engage in efforts to share information and develop positive relationships with Indigenous communities that have cultural, spiritual, and economic interests in the areas where we operate. This focused engagement enables us to further understand and observe the rights of Indigenous groups relating to forestry activities while also minimizing risks to our business operations. Nonetheless, final or interim resolution of claims brought forward by Canadian provincial governments and Indigenous nations may result in additional restrictions on wood supply, potentially affecting our operational costs and/or timber prices over the long term.
LEGAL AND REGULATORY RISK FACTORS
We are subject to significant environmental regulation and environmental compliance expenditures and liabilities. Our business is subject to many environmental laws and regulations, particularly with respect to discharges of pollutants and other emissions on or into the land, water, and air, the disposal and remediation of hazardous substances or other contaminants, and the restoration and reforestation of timberlands. Compliance with these laws and regulations is a significant factor in our business. We have incurred and expect to continue to incur significant expenditures to comply with applicable environmental laws and regulations. Moreover, changes to the environmental laws and regulations to which we are subject and the enactment of new environmental laws, regulations, or other requirements, including with respect to greenhouse gas emissions or climate change, may cause us to incur increased and unexpected compliance costs or impose restrictions on our ability to manufacture our products or operate our business. In addition, there has historically been, and there continues to be, a lack of consistent climate legislation, which has created and continues to create economic and regulatory uncertainty. Our failure to comply with applicable environmental laws and regulations and permit requirements could result in civil or criminal fines or penalties or enforcement actions, including regulatory or judicial orders enjoining or curtailing operations or requiring corrective measures, installation of pollution control equipment, or remedial actions, as well as reputational harm.
Some environmental laws and regulations impose liability and responsibility on present and former owners, operators, or users of facilities and sites for contamination at such facilities and sites, without regard to causation or knowledge of contamination. In addition, we occasionally evaluate various alternatives with respect to our facilities, including possible dispositions or closures. Investigations undertaken in connection with these activities may lead to discoveries of contamination that must be remediated, and closures of facilities may trigger compliance requirements that are not applicable to operating facilities. Consequently, we cannot guarantee that existing or future circumstances or developments with respect to contamination will not require significant expenditures by us or have significant adverse impact on our operations.
20
We are subject to various environmental, product liability, and other legal proceedings, matters, and claims. The outcome of these proceedings, matters, and claims, and the magnitude of related costs and liabilities, are subject to uncertainties. We currently are, or from time to time in the future may be, involved in a number of environmental matters and legal proceedings, including legal proceedings involving antitrust, warranty or non-warranty product liability claims, negligence, and other claims, including claims for wrongful death, personal injury and property damage alleged to have arisen out of use by others of our or our predecessors’ products or the release by us or our predecessors of hazardous substances. The conduct of our business involves the use of hazardous substances and the generation of contaminants and pollutants. In addition, the end-users of many of our products are members of the general public. Environmental matters and other legal matters and proceedings, including class action settlements relating to certain of our products, have in the past caused and, in the future may cause, us to incur substantial costs. The actual or alleged existence of defects in any of our products could also subject us to significant product liability claims. We have established contingency reserves in our Consolidated Financial Statements with respect to the estimated costs of existing environmental matters and legal proceedings to the extent that our management has determined that such costs are both probable and reasonably estimable as to amount. However, such reserves are based upon various estimates and assumptions relating to future events and circumstances, all of which are subject to inherent uncertainties. We regularly monitor our estimated exposure to environmental and litigation loss contingencies and, as additional information becomes known, may change our estimates significantly. However, no estimate of the range of any such change can be made at this time. We may incur costs in respect of existing and future environmental matters and legal proceedings as to which no contingency reserves have been established. There is no assurance that we will have sufficient resources available to satisfy the related costs and expenses associated with these matters or proceedings. The incurring of costs in excess of our contingency reserves could have a material adverse effect on our business, financial condition, and results of operations.
We are subject to the U.S. Foreign Corrupt Practices Act and other anti-corruption laws, as well as other international trade and regulatory laws governing our operations. If we fail to comply with these laws, we could be subject to civil or criminal penalties, other remedial measures, and legal expenses, which could adversely affect our business, financial condition, and results of operations. Our operations are subject to anti-corruption laws, including the U.S. Foreign Corrupt Practices Act (FCPA) and other anti-corruption laws that apply in countries where we do business. The FCPA and these other laws generally prohibit us and our employees and intermediaries from bribing, being bribed or making, promising, offering or authorizing payments or gifts, with corrupt intent, to government officials or other persons to obtain or retain business or gain some other business advantage. We conduct business in a number of jurisdictions that are geographically high-risk for violations of anti-corruption laws, we participate in relationships with third parties whose actions could potentially subject us to liability under the FCPA or other anti-corruption laws, and the nature of our business involves interaction with government officials. In addition, we cannot predict the nature, scope, or effect of future regulatory requirements to which our operations might be subject or the manner in which existing laws might be administered or interpreted.
We are also subject to other laws and regulations governing our international operations, including regulations administered by the U.S. Department of Commerce’s Bureau of Industry and Security, the U.S. Department of Treasury’s Office of Foreign Assets Control, and various non-U.S. government entities, including applicable export control regulations, economic sanctions on countries, entities and other persons, customs requirements, anti-boycott regulations, currency exchange regulations and transfer pricing regulations (collectively, Trade Control Laws).
We have and maintain a compliance program with policies, procedures, and employee training to help ensure compliance with the FCPA, other applicable anti-corruption laws, and Trade Control Laws. However, despite our compliance program, there is no assurance that we or our intermediaries will be completely effective in complying with all applicable anti-corruption laws, including the FCPA or other legal requirements or Trade Control Laws. If we or our intermediaries are not in compliance with the FCPA and other anti-corruption laws or Trade Control Laws, we may be subject to criminal and civil penalties, disgorgement and other sanctions and remedial measures, and legal expenses, which could have an adverse impact on our business, financial condition, results of operations and liquidity.
Likewise, any investigation of any potential violations of the FCPA, other anti-corruption laws, or Trade Control Laws by the U.S. or foreign authorities could also have an adverse impact on our reputation, business, financial condition, and results of operations.
21
Regulatory and statutory changes applicable to us or our customers, including changes in tax law or effective tax rates, could adversely affect our financial condition and results of operations. We, and many of our customers, are subject to various national, state and local laws, rules, and regulations. Changes in any of these laws, rules, or regulations could result in additional compliance costs, seizures, confiscations, recalls or monetary fines, any of which could prevent or inhibit the manufacture, distribution and sale of our products.
We are also subject to periodic examination of our income tax returns by the Internal Revenue Service and other tax authorities. We regularly assess the likelihood of adverse outcomes resulting from these examinations to determine the adequacy of our provision for income taxes. There can be no assurance that the outcomes from these examinations will not have a material adverse effect on our business, financial condition, and results of operations, or that our provision for income taxes will be sufficient.
We are also exposed to changes in tax laws, as well as any future regulations issued and changes in interpretations of tax laws, which can impact our current and future years' tax provisions. We monitor tax legislation changes on a global basis, including changes arising as a result of the Organization for Economic Cooperation and Development’s multi-jurisdictional plan of action to address base erosion and profit shifting, commonly referred to as the Pillar Two Inclusive Framework and the 2025 One Big Beautiful Bill Act (“The Tax Act”) with effective dates of enacted provisions ranging from 2025 through 2027. Both Pillar Two and The Tax Act are discussed further in "Note 6, Income Taxes" of the Notes to the Consolidated Financial Statements included in Item 8 of this annual report on Form 10-K. The effect of any other tax law changes or regulations and interpretations, as well as any additional tax legislation in the U.S. or other jurisdictions in which we operate, could have a material adverse effect on our business, financial condition, and results of operations.
In addition, our products and markets are subject to extensive and complex federal, local, state, and foreign statutes, ordinances, rules, and regulations. These mandates, including building design and safety and construction standards and zoning requirements, affect the cost, selection, and quality requirements of building components, such as the structural panel and siding products that we manufacture and sell, and often provide broad discretion to governmental authorities as to the types and quality specifications of products used in new home construction and repair and remodeling projects. Compliance with these standards and changes in such statutes, ordinances, rules, and regulations may increase the costs of manufacturing our products or may reduce the demand for certain of our products in the affected geographical areas or product markets. Conversely, a decrease in product safety standards could reduce demand for our more modern products if less expensive alternatives that do not meet higher standards were to become available for use in the affected geographical areas or product markets. All or any of these changes could have a material adverse effect on our business, financial condition, and results of operations.
FINANCIAL RISK FACTORS
Inflation may adversely affect us by increasing costs of raw materials, labor, and other costs beyond what we can recover through price increases. Inflation can adversely affect us by increasing the costs of raw materials and labor, and other goods or services required to operate and grow our business. Many of the markets in which we sell our products have experienced high levels of inflation in recent periods and may continue to experience high levels of inflation in the future, which may depress consumer demand for our products and reduce our profitability if we are unable to raise prices enough to keep up with increases in our costs. Inflationary pressures have resulted in increases in the cost of certain raw materials, and other supplies necessary for the production of our products, and such increases may continue to impact us in the future and expose us to risks associated with significant levels of cost inflation. If we are unable to increase our prices to offset the effects of inflation, our business, operating results, and financial condition could continue to be materially and adversely affected.
Warranty claims relating to our products and exceeding our warranty reserves could have a material adverse effect on our business. We have offered, and continue to offer, various warranties on our products. Although we maintain reserves for warranty-related claims and we have established and recorded product-related warranty reserves on our Consolidated Financial Statements, we cannot guarantee that warranty expense levels or the results of any warranty-related legal proceedings will not exceed our reserves. If our warranty reserves are significantly exceeded, the costs associated with such warranties could have a material adverse effect on our financial position, results of operations, and cash flows.
22
We have not independently verified the results of third-party research or confirmed assumptions or judgments upon which it may be based, and the forecasted and other forward-looking information contained therein is subject to inherent uncertainties. We have referred to, and may in the future refer to, in our annual reports on Form 10-K, quarterly reports on Form 10-Q, and other documents that we file with, or furnish to, the SEC, historical, forecasted, and other forward-looking information published by sources such as the U.S. Census Bureau that we believe to be reliable. However, we have not independently verified this information and, with respect to the forecasted and forward-looking information, have not independently confirmed the assumptions and judgments upon which it is based. Forecasted and other forward-looking information is necessarily based on assumptions regarding future occurrences, events, conditions, and circumstances and subjective judgments relating to various matters and is subject to inherent uncertainties. Actual results may differ materially from the results expressed or implied by, or based upon, such forecasted and forward-looking information.
Because we have operations outside the United States and report our earnings in U.S. dollars, unfavorable fluctuations in currency values and exchange rates could have a material adverse effect on our results of operations. Because our reporting currency is the U.S. dollar, our non-U.S. operations face the additional risk of fluctuating currency values and exchange rates. Such operations may also face hard currency shortages and controls on currency exchange. Changes in the value of foreign currencies (principally Canadian dollars, Brazilian reals, Chilean pesos, and Argentine pesos) could have an adverse effect on our results of operations. We have, in the past, entered into foreign exchange contracts associated with certain of our indebtedness and may continue to enter into foreign exchange contracts associated with major equipment purchases to manage a portion of the foreign currency rate risk. We historically have not entered into currency rate hedges with respect to our exposure from operations, although we may do so in the future. There can be no assurance that fluctuation in foreign currencies and other foreign exchange risks will not have a material adverse effect on our financial position, results of operations, or cash flows.
Covenants and events of default in our debt instruments could limit our ability to undertake certain types of transactions and adversely affect our liquidity. Our Amended Credit Agreement (as defined below) and the indenture governing the 2029 Senior Notes (as defined below) contain a number of restrictive covenants that impose operating and financial restrictions on us and may limit our ability to engage in acts that may be in our long-term best interests, including, among others, restrictions on our ability to incur indebtedness, grant liens to secure indebtedness, engage in sale and leaseback transactions, and merge or consolidate or sell all or substantially all of our assets.
In addition, restrictive covenants in our Amended Credit Agreement require us to maintain specified financial ratios and satisfy other financial condition tests. Our ability to meet those financial ratios and tests can be affected by events beyond our control, and we may be unable to meet them.
A breach of the covenants or restrictions under our Amended Credit Agreement or under the indenture governing the 2029 Senior Notes could result in an event of default under the applicable indebtedness. Such a default may allow our creditors to accelerate the related debt. A payment default or an acceleration following an event of default under our Amended Credit Agreement or our indenture governing the 2029 Senior Notes could trigger an event of default under the other indebtedness obligation, as well as any other debt to which a cross-acceleration or cross-default provision applies, which could result in the principal of and the accrued and unpaid interest on all such debt becoming due and payable ahead of schedule. In addition, an event of default under our Amended Credit Agreement could permit the lenders under our Amended Credit Facility (as defined below) to terminate all commitments to extend further credit under that facility. Furthermore, if we were unable to repay any amounts due and payable under our Amended Credit Facility, those lenders could proceed against the collateral granted to them to secure that indebtedness, to the extent any such collateral is granted thereunder. In the event our lenders or noteholders accelerate the repayment of our borrowings, we and our subsidiaries may not have sufficient assets to repay that indebtedness.
23
As a result of these restrictions, we may be:
•limited in how we conduct our business and grow in accordance with our strategy;
•unable to raise additional debt or equity financing to operate during general economic or business downturns; or
•unable to compete effectively or to take advantage of new business opportunities.
In addition, our financial results, our level of indebtedness, and our credit ratings could adversely affect the availability and terms of any additional or replacement financing.
More detailed descriptions of our Amended Credit Agreement and the indenture governing the 2029 Senior Notes are included in filings made by us with the SEC, along with the documents themselves, copies of which are filed as exhibits to this annual report on Form 10-K and which provide the full text of these covenants.
We are subject to interest rate risk under our Amended Credit Facility. Borrowings under our Amended Credit Facility are at variable rates of interest based on (a) a “base rate” plus a margin of 0.500% to 1.500% or (b) Adjusted Term SOFR (i.e., Term SOFR Rate plus an adjustment of 0.10%), which is based upon the Secured Overnight Financing Rate (SOFR), plus a margin of 1.500% to 2.500%, and therefore expose us to interest rate risk. The “base rate” is the highest of (i) the Federal funds rate plus 0.5%, (ii) the U.S. prime rate, and (iii) one-month Adjusted Term SOFR plus 1.0%.
Our cash, cash equivalents and investments could be adversely affected if the financial institutions in which we hold our cash, cash equivalents and investments fail. We regularly maintain cash balances at third-party financial institutions in excess of the Federal Deposit Insurance Corporation insurance limit. If certain banks and financial institutions enter receivership or become insolvent in the future in response to financial conditions affecting the banking system and financial markets, our ability to access our existing cash, cash equivalents and investments may be threatened and could have a material adverse effect on our business and financial condition.
GENERAL RISK FACTORS
We are subject to a variety of other risks as a publicly traded U.S. manufacturing company. As a publicly traded U.S. manufacturing company, we are subject to a variety of other risks, each of which could adversely affect our financial position, results of operations or cash flows, or the price of our common stock. These risks include but are not limited to the following, in addition to the other risks described above:
•changes in general and global economic conditions, including impacts from rising inflation, supply chain disruptions, new, ongoing, or escalated geopolitical or military conflicts or tensions;
•compliance with a wide variety of health and safety laws and regulations and changes to such laws and regulations;
•the exertion of influence over us, individually or collectively, by a few entities with concentrated ownership of our stock;
•new or modified legislation related to health care, data privacy, AI, climate change or cybersecurity;
•compliance with Section 404 of the Sarbanes-Oxley Act of 2002, including the potential impact of compliance failures; and
•failure to meet the expectations of investors, including as a result of factors beyond the control of an individual company.
ITEM 1B. Unresolved Staff Comments
None.
24
ITEM 1C. Cybersecurity
CYBERSECURITY OVERSIGHT
Risk Management and Strategy
To respond to the threat of security breaches and cyberattacks, we maintain a cybersecurity program designed to protect and preserve the confidentiality, integrity and continued availability of all information and operational processes owned by, or in the care of, LP. This program includes mechanisms to monitor and detect unusual network activity, cybersecurity incident response and containment tools, and a response plan that provides controls and procedures for timely and accurate reporting of any material cybersecurity incident. We also have a cybersecurity training and compliance program in place for the Company whereby our connected employees receive training and are tested routinely through simulated phishing attempts.
We rely heavily on third-party suppliers and vendors, and a cybersecurity incident at one of our suppliers or vendors could have a material adverse impact on our business operations. We evaluate third-party cybersecurity risk controls through various assessment activities carried out by LP employees and by third-party service providers acting on our behalf. We engage independent third parties to conduct, on an annual basis, either a Security Program Assessment under the Capability Maturity Model Integration (CMMI) framework or the National Institute of Standards and Technology (NIST) framework, or targeted penetration testing combined with security controls assessments. For incident alerts and response, we outsource around-the-clock coverage to a third-party managed service provider who provides timely alerting and notification of potential cybersecurity issues. We continually work with third-party experts to advise on new threats and cybersecurity strategy best practices for specific capabilities.
Management Responsibilities
Our cybersecurity program is managed by our Information Security Officer (ISO) . Our ISO has over eight years of cybersecurity experience working in publicly traded companies, with expertise leading risk remediation efforts in vulnerability management, network security, security awareness, threat monitoring, data security and cloud security.
25
Board Responsibilities
Oversight of risks from cybersecurity threats is shared by the Board of Directors and the FAC. The FAC oversees our cybersecurity program. The ISO provides the FAC with an annual presentation on our cybersecurity program, emerging threats, and the state of LP’s cybersecurity maturity. In addition, the ISO provides updates to the FAC no less often than annually with respect to additional information regarding the cybersecurity program.
26
ITEM 2. Properties
We lease office space from third parties for our corporate headquarters in Nashville, Tennessee and our South American headquarters in Santiago, Chile. Information regarding our principal manufacturing facilities, all of which we own, and their production capacities is set forth in the following table. Information regarding operating production capacities is based on annual typical operating rates and normal production mixes under current market conditions, considering known constraints such as log supply. Market conditions, fluctuations in log supply, environmental restrictions, and the nature of current orders may cause actual production rates and mixes to vary significantly from the production rates and mixes shown.
| OSB | Siding | |||||||||||||
OSB production facilities - 3/8” basis, million square feet | Siding production facilities - 3/8” basis, million square feet | |||||||||||||
| Carthage, TX | 500 | Dawson Creek, British Columbia, Canada1 | 300 | |||||||||||
| Clarke County, AL | 725 | Hayward, WI1 | 475 | |||||||||||
| Hanceville, AL | 420 | Houlton, ME1 | 220 | |||||||||||
| Jasper, TX | 475 | Newberry, MI | 165 | |||||||||||
Maniwaki, Quebec, Canada2 | 650 | Sagola, MI1 | 300 | |||||||||||
| Peace Valley, British Columbia, Canada | 800 | Swan Valley, Manitoba, Canada1 | 380 | |||||||||||
| Roxboro, NC | 525 | Tomahawk, WI | 245 | |||||||||||
| 7 facilities | 4,095 | Two Harbors, MN | 235 | |||||||||||
| 8 facilities | 2,320 | |||||||||||||
| South America | Siding finishing facilities - 3/8” basis, million square feet | |||||||||||||
| OSB/Siding production facilities - 3/8” basis, million square feet | Bath, NY | 55 | ||||||||||||
| Lautaro, Chile | 160 | Green Bay, WI | 105 | |||||||||||
| Panguipulli, Chile | 300 | Roaring River, NC | 75 | |||||||||||
| Ponta Grossa, Brazil | 330 | 3 facilities | 235 | |||||||||||
| 3 facilities | 790 | |||||||||||||
1 The Dawson Creek, British Columbia, Canada; Hayward, WI; Houlton, ME; Sagola, MI; and Swan Valley, Manitoba, Canada plants are used in the operations of our Siding segment but can also produce commodity OSB when market conditions warrant.
2 We own a logging operation in Maniwaki, Ontario, Canada, which supports our OSB operations at that location.
27
ITEM 3. Legal Proceedings
ENVIRONMENTAL MATTERS
We are involved in a number of environmental proceedings and activities and may be wholly or partially responsible for known or unknown contamination existing at a number of sites at which we have conducted operations or disposed of waste. Based on the information currently available, management does not believe that any fines, penalties, or other costs or losses resulting from these matters could reasonably be expected to have a material adverse effect on our financial position, results of operations, cash flows, or liquidity.
OTHER PROCEEDINGS
We are party to other legal proceedings in the ordinary course of business. Based on the information currently available, we do not believe that the resolution of such proceedings could reasonably be expected to have a material adverse effect on our financial position, results of operations, cash flows, or liquidity.
CONTINGENCY RESERVES
We maintain reserves for the estimated cost of the legal and environmental matters referred to above. However, as with any estimate, the uncertainty of predicting the outcomes of claims, litigation and environmental investigations and remediation efforts could cause actual costs to vary materially from current estimates. Due to various uncertainties, we cannot predict to what actual degree payments will exceed the recorded liabilities related to these matters. However, it is possible that, in either the near term or the longer term, revised estimates or actual payments will significantly exceed the recorded liabilities.
For information regarding our financial statement reserves for the estimated costs of the environmental and legal matters referred to above, see “Note 12 - Commitments and Contingencies” of the Notes to the Consolidated Financial Statements included in Item 8 in this annual report on Form 10-K.
ITEM 4. Mine Safety Disclosures
Not applicable.
28
PART II
ITEM 5. Market for Registrant’s Common Equity, Related Stockholder Matters and Issuer Purchases of Equity Securities
The common stock of LP is listed on the New York Stock Exchange with the ticker symbol “LPX.” As of February 13, 2026, there were approximately 3,085 stockholders of record of our common stock.
DIVIDEND POLICY
We paid quarterly cash dividends of $0.28 per share for each quarter of 2025. We paid quarterly cash dividends of $0.26 per share for each quarter of 2024. On February 13, 2026, we declared a quarterly dividend of $0.30 per share, payable on March 13, 2026, to stockholders of record as of the close of business on February 27, 2026. We will continue to review our ability to pay cash dividends on an ongoing basis, and the payment of dividends in the future is subject to the discretion of LP’s Board of Directors and is dependent upon, among other factors, our financial condition, general market and business conditions, and legal and contractual restrictions on the payment of dividends, including compliance with the terms of our Amended Credit Agreement.
ISSUER PURCHASES OF EQUITY SECURITIES
In May 2024, our Board of Directors authorized a share repurchase program under which LP was authorized to repurchase up to $250 million of its outstanding common stock (the 2024 Share Repurchase Program). We did not make any repurchases of LP common stock pursuant to the 2024 Share Repurchase program or otherwise during the quarter ended December 31, 2025. As of December 31, 2025, LP had $177 million of repurchase authorization remaining under the 2024 Share Repurchase Program. LP may initiate, discontinue, or resume purchases of its common stock under the 2024 Share Repurchase Program in the open market, in block transactions, or in privately negotiated transactions, including under Rule 10b5-1 plans, at times and in such amounts as management deems appropriate without prior notice, subject to market and business conditions, regulatory requirements, and other factors.
29
PERFORMANCE GRAPH
The following graph compares the cumulative total stockholder return, including dividends paid (assuming reinvestment of dividends) and appreciation or depreciation in stock price, from a $100 investment in LP common stock for the period from December 31, 2020 through December 31, 2025, to the cumulative total stockholder return from a $100 investment in the Standard & Poor’s 500 Stock Index and Standard & Poor’s Building Products Index for the same period. Stockholders are cautioned that the graph shows the returns to investors as of the dates noted and may not be representative of the returns for any other past or future periods.
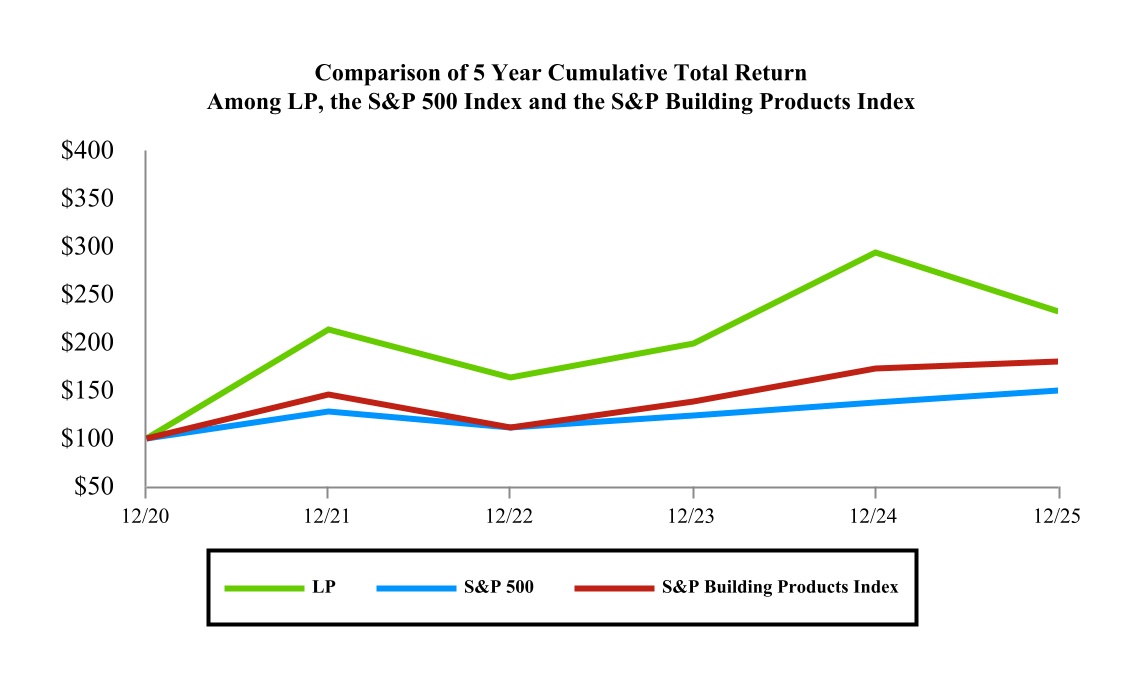
The graph is not deemed to be “soliciting material” and is “furnished” and shall not be deemed to be “filed” with the SEC or incorporated by reference in any filing under Exchange Act or the Securities Act, except as shall be expressly set forth by specific reference in any such filing.
ITEM 6. (Reserved)
ITEM 7. Management’s Discussion and Analysis of Financial Condition and Results of Operations
This Management’s Discussion and Analysis of Financial Condition and Results of Operations should be read in conjunction with our Consolidated Financial Statements and related Notes and other financial information appearing elsewhere in this annual report on Form 10-K, and with Part II, Item 7 “Management’s Discussion and Analysis of Financial Condition and Results of Operations” in our annual report on Form 10-K for our fiscal year ended December 31, 2024, filed with the SEC on February 19, 2025, which provides a discussion of our financial condition and results of operations for fiscal year 2024 compared to fiscal year 2023. The changes to our reportable segments in the current year did not have a material impact on our previously reported consolidated results of operations or financial position. Prior‑period segment information has been recast to conform to the current period presentation. The following discussion includes forward-looking statements that are based on the beliefs of our management, as well as assumptions made by, and information currently available to, our management. We encourage you to review the risks and uncertainties described in the sections titled “Cautionary Statement Regarding Forward-Looking Statements” and “Risk Factors” above. Our historical results are not necessarily indicative of the results that may be expected for any period in the future.
30
OVERVIEW
General
We are a leading provider of high-performance building solutions that meet the demands of builders, remodelers, and homeowners worldwide. We have leveraged our expertise serving the new home construction, repair and remodeling, and outdoor structures markets to become an industry leader known for innovation, quality, and reliability. To serve these markets, we operate in two reportable segments: Siding and OSB.
Executive Summary
In 2025, net sales dropped year over year by $233 million to $2.7 billion. Siding revenue increased by $131 million, or 8%, to $1.7 billion, attributable to 4% higher sales volumes and a 4% increase in prices. OSB revenue fell by $352 million to $832 million, primarily due to lower prices and sales volumes.
Net income declined year over year by $275 million to $146 million ($2.08 per diluted share). The primary drivers behind this decrease were a $252 million reduction in Adjusted EBITDA, and increases of $38 million in impairment charges, $24 million in foreign currency losses, $19 million in depreciation expense, and $10 million in stock-based compensation. Additionally, the absence of $14 million in business exit credits recognized in 2024 and a $7 million decrease in investment income contributed to the overall decline. These impacts were partially offset by a $90 million reduction in the tax provision. The year-over-year decrease in Adjusted EBITDA was driven by several factors, including a $292 million adverse effect from lower OSB prices and reduced sales volumes, partially offset by $91 million from higher Siding sales volumes and improved sales mix. In addition to price and volume impacts, the change in Adjusted EBITDA included increases of $11 million in marketing investments, $9 million in selling, general, and administrative expenses, $7 million of mill overhead and inventory absorption, and $8 million in tariff costs. The remaining decrease in Adjusted EBITDA relates to a decline of $15 million in Other Adjusted EBITDA, which primarily includes LPSA, corporate, and other minor products and services. Adjusted EBITDA is a non-GAAP Financial measure. Please see "Non-GAAP Financial Measures" below for more information about our use of non-GAAP financial measures in this annual report on Form 10-K and the reconciliation of Adjusted EBITDA to net income.
Demand for Building Products
Demand for our products correlates positively with new home construction and repair and remodeling activity in North America, which historically have been characterized by significant cyclicality. The U.S. Census Bureau published actual U.S. housing starts data on January 9, 2026. The U.S. Census Bureau reported on January 9, 2026, that 2025 actual single-family housing starts were 6% lower than those in 2024. Actual multi-family housing starts in 2025 were about 18% higher than those in 2024. Repair and remodeling activity is difficult to reasonably measure, but many indications suggest that repair and remodeling activity has declined modestly year-over-year.
Future economic conditions in the United States and the demand for homes are uncertain due to inflationary impacts on the economy, including interest rates, employment levels, consumer confidence, and financial markets, among other things. Additionally, we have experienced increases in material prices, supply disruptions, and labor challenges, which we continue to address as we work to meet the demands of builders, remodelers, and homeowners worldwide. The potential effect of these factors on our future operational and financial performance is uncertain. As a result, our past performance may not be indicative of future results.
31
The chart below, which is based on data published by U.S. Census Bureau, provides a graphical summary of new housing starts for single- and multi-family in the U.S., showing actual and rolling five- and ten-year averages for housing starts (in thousands).
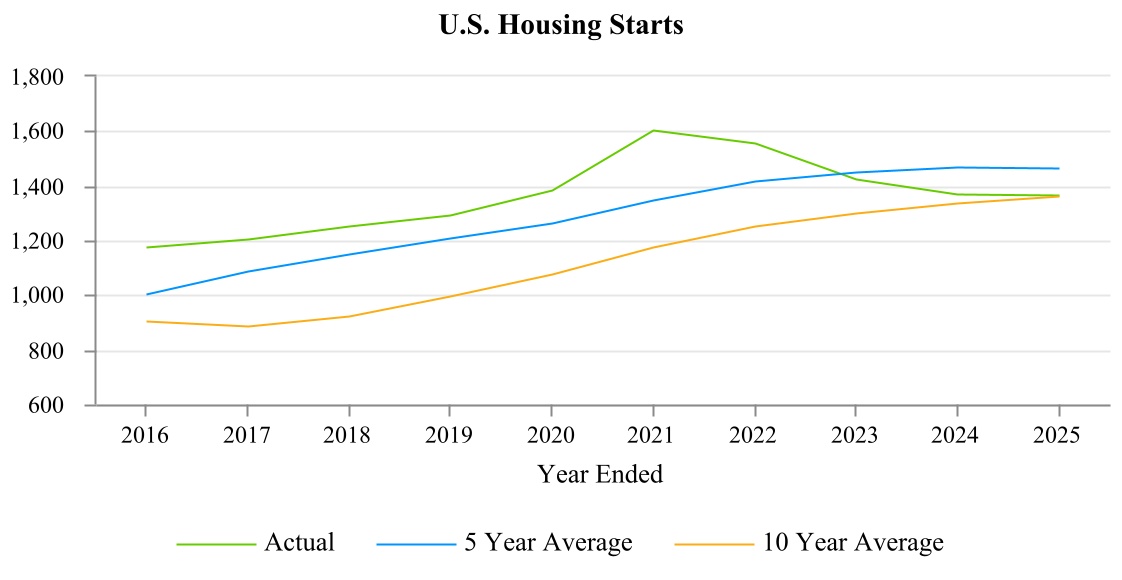
November and December 2025 housing starts have not yet been published by the U.S. Census Bureau, and therefore, for the purpose of the chart above, we have used October 2025 housing starts previously published by the U.S. Census Bureau as the November and December 2025 actual housing starts.
Supply and Demand for Siding
Our Siding products are specialty building materials and are subject to competition from various siding technologies, including vinyl, stucco, wood, fiber cement, brick, and others. We believe we are the largest manufacturer of engineered wood siding in North America and South America. The global siding market is estimated to be approximately $120 billion of annual expenditure. We have consistently grown our Siding business above the underlying market growth rates. Our Siding business is generally less sensitive to new housing market cyclicality since a majority of its demand comes from other markets, including off-site structure producers and repair and remodel. Our growth in this market depends upon the continued displacement of vinyl, stucco, wood, fiber cement, brick, and other alternatives, our product innovation and our technological expertise in wood and wood composites to address the needs of our customers.
Supply and Demand for OSB
OSB is a commodity product, and it is subject to competition from manufacturers worldwide. Product supply is influenced primarily by fluctuations in available manufacturing capacity and imports. The ratio of overall OSB demand to capacity generally drives price. We cannot predict whether the prices of our OSB products will remain at current levels or increase or decrease in the future.
32
CRITICAL ACCOUNTING POLICIES AND SIGNIFICANT ESTIMATES
Management’s Discussion and Analysis of Financial Condition and Results of Operations are based upon our Consolidated Financial Statements, which have been prepared in accordance with U.S. GAAP. The preparation of these financial statements requires management to make informed estimates and judgments that affect the reported amounts of assets, liabilities, revenues and expenses, and related disclosure of contingent assets and liabilities. Our financial position and/or results of operations may be materially different when reported under different conditions or when using different assumptions in the application of such policies. In the event estimates or assumptions prove to be different from actual amounts, adjustments are made in subsequent periods to reflect more current information. Our significant accounting policies are disclosed in “Note 1 - Summary of Significant Accounting Policies” of the Notes to the Consolidated Financial Statements and included in Item 8 of this annual report on Form 10-K. The following discussion addresses our most critical accounting policies, which are those that are both important to the portrayal of our financial condition and results of operations and that require significant judgment or use of complex estimates.
Long-lived Assets
Property, plant and equipment, and long-lived assets (including amortizable identifiable intangible assets) are tested for recoverability whenever events or changes in circumstances indicate that their carrying amount may not be recoverable, including but not limited to facility curtailments and asset abandonments. When such events occur, we group long-lived assets with other assets and liabilities at the lowest level for which identifiable cash flows exist. We compare the sum of the undiscounted cash flows expected to result from the use and eventual disposition of the asset or asset group to the carrying amount of a long-lived asset or asset group. The cash flows are based on our best estimate of future cash flows derived from the most recent business projections. The significant assumptions used to determine estimated cash flows are the cash inflows and outflows directly resulting from the use of those assets in operations, including sales volume, product pricing, support costs, and other costs to operate. We recognize an impairment loss if the amount of the asset’s carrying value exceeds the asset’s estimated fair value. Fair value is estimated primarily using discounted expected future cash flows on a market-participant basis. If we recognize an impairment loss, the adjusted carrying amount of the asset becomes its new cost basis. For a depreciable long-lived asset, the new cost basis is depreciated (amortized) over the remaining estimated useful life of that asset.
Our impairment loss calculations contain uncertainties because they require management to make assumptions and to apply judgment to estimate future cash flows and asset fair values. We have not made any material changes in our impairment loss assessment methodology in the periods presented. We do not believe a material change in the estimates or assumptions that we use to calculate long-lived asset impairments is likely. However, if actual results are not consistent with our estimates and assumptions used in estimating future cash flows and asset fair values, we may be exposed to losses that could be material.
Revenue Recognition, Including Customer Program Costs
Revenue is recognized when obligations under the terms of a contract (e.g., purchase orders) with our customers are satisfied; generally, this occurs with the transfer of control of our products to the customer at a point in time. Revenue is measured as the amount of consideration we expect to receive in exchange for transferring goods. The shipping cost incurred by us to deliver products to our customers is recorded in cost of sales.
Our businesses routinely incur customer program costs to obtain favorable product placement, promote sales of products, and maintain competitive pricing. Customer program costs and incentives, including rebates and promotion and volume allowances, are accounted for as a reduction in net sales at the time the program is initiated and/or the revenue is recognized. The costs include, but are not limited to, volume allowances and rebates, promotional allowances, and cooperative advertising programs. These costs are recorded at the later of the time of sale or the implementation of the program based on management’s best estimates.
Our estimates are based on historical and projected experience for each type of program or customer. Volume allowances are accrued based on our estimates of customer volume achievement and other factors incorporated into customer agreements, such as new product purchases, store sell-through, merchandising support, and customer training.
33
Although we believe we can reasonably estimate customer volumes and support and the related customer payments at interim periods, it is possible that actual results could be different from previously estimated amounts. At the end of each year, a significant portion of the actual volume and support activity is known. Thus, we do not currently believe that a material change in the amounts recorded as customer program costs payable is reasonably likely. We had $50 million and $48 million accrued as customer rebates as of December 31, 2025 and 2024, respectively.
We ship some of our products to customers’ distribution centers on a consignment basis. We retain title to our products stored at the distribution centers. As our products are removed from the distribution centers by retailers and shipped to retailers’ stores, title passes from us to the retailers. At that time, we invoice the retailers and recognize revenue for these consignment transactions. We do not offer a right of return for products shipped to the retailers’ stores from the distribution centers.
34
NON-GAAP FINANCIAL MEASURES
In evaluating our business, we utilize non-GAAP financial measures that fall within the meaning of SEC Regulation G and Regulation S-K Item 10(e), which we believe provide users of the financial information with additional meaningful comparison to prior reported results. Non-GAAP financial measures do not have standardized definitions and are not defined by U.S. GAAP. In this annual report on Form 10-K, we disclose net income excluding interest expense, provision for income taxes, depreciation and amortization, stock-based compensation expense, loss on impairment, business exit credits and charges, product-line discontinuance charges, other operating credits and charges, net, loss on early debt extinguishment, investment income, pension settlement charges, other non-operating income (expense), income from discontinued operations, net of income taxes, and net income attributed to noncontrolling interest, as Adjusted EBITDA (Adjusted EBITDA), which is a non-GAAP financial measure. We have included Adjusted EBITDA in this report because we view it as an important supplemental measure of our performance and believe that it is frequently used by interested persons in the evaluation of companies that have different financing and capital structures and/or tax rates. We also disclose net income, excluding loss on impairment, business exit credits and charges, product-line discontinuance charges, interest expense outside of normal operations, other operating credits and charges, net, loss on early debt extinguishment, gain (loss) on acquisition, pension settlement charges, income from discontinued operations, net of income taxes, and net income attributed to noncontrolling interest, and adjusting for a normalized tax rate, as Adjusted Income (Adjusted Income), which is a non-GAAP financial measure. In addition, we disclose Adjusted Diluted EPS, calculated as Adjusted Income divided by diluted shares outstanding (Adjusted Diluted EPS), which is a non-GAAP financial measure. We believe that Adjusted Diluted EPS and Adjusted Income are useful measures for evaluating our ability to generate earnings and that providing these measures should allow interested persons to more readily compare the earnings for past and future periods. Reconciliations of Adjusted EBITDA, Adjusted Income and Adjusted Diluted EPS to their most directly comparable U.S. GAAP financial measures, net income, and net income per share of common stock - diluted, respectively, are presented below.
Adjusted EBITDA, Adjusted Income, and Adjusted Diluted EPS are not substitutes for the U.S. GAAP measures of net income and net income per share of common stock - diluted or for any other U.S. GAAP measures of operating performance. It should be noted that other companies may present similarly titled measures differently, and therefore, as presented by us, these measures may not be comparable to similarly titled measures reported by other companies. Adjusted EBITDA, Adjusted Income, and Adjusted Diluted EPS have material limitations as performance measures because they exclude items that are actually incurred or experienced in connection with the operation of our business.
35
The following table presents significant items and reconciles net income to Adjusted EBITDA (dollar amounts in millions):
| Year Ended December 31, | |||||||||||||||||
| 2025 | 2024 | 2023 | |||||||||||||||
| Net income | $ | 146 | $ | 420 | $ | 178 | |||||||||||
| Add (deduct): | |||||||||||||||||
| Provision for income taxes | 50 | 140 | 74 | ||||||||||||||
| Depreciation and amortization | 145 | 126 | 119 | ||||||||||||||
| Stock-based compensation expense | 30 | 20 | 13 | ||||||||||||||
| Loss on impairment | 44 | 5 | 6 | ||||||||||||||
| Other operating credits and charges, net | 6 | 8 | 18 | ||||||||||||||
Product-line discontinuance charges | 2 | — | — | ||||||||||||||
| Business exit credits and charges | — | (14) | 32 | ||||||||||||||
| Pension settlement charges | — | — | 4 | ||||||||||||||
| Interest expense | 15 | 14 | 14 | ||||||||||||||
| Investment income | (16) | (22) | (18) | ||||||||||||||
| Other non-operating expense (income) | 15 | (9) | 39 | ||||||||||||||
| Adjusted EBITDA | $ | 436 | $ | 688 | $ | 478 | |||||||||||
| Siding | 444 | 390 | 269 | ||||||||||||||
| OSB | 7 | 298 | 220 | ||||||||||||||
| Other | (15) | — | (11) | ||||||||||||||
| Adjusted EBITDA | $ | 436 | $ | 688 | $ | 478 | |||||||||||
The following table provides the reconciliation of net income to Adjusted Income (dollar amounts in millions, except earnings per share):
| Year Ended December 31, | |||||||||||||||||
| 2025 | 2024 | 2023 | |||||||||||||||
| Net income per share of common stock - diluted | $ | 2.08 | $ | 5.89 | $ | 2.46 | |||||||||||
| Net income | $ | 146 | $ | 420 | $ | 178 | |||||||||||
| Add (deduct): | |||||||||||||||||
| Loss on impairment | 44 | 5 | 6 | ||||||||||||||
| Other operating credits and charges, net | 6 | 8 | 18 | ||||||||||||||
Product-line discontinuance charges | 2 | — | — | ||||||||||||||
| Business exit credits and charges | — | (14) | 32 | ||||||||||||||
| Pension settlement charges | — | — | 4 | ||||||||||||||
| Reported tax provision | 50 | 140 | 74 | ||||||||||||||
| Adjusted income before tax | 247 | 559 | 311 | ||||||||||||||
Normalized tax provision at 25%1 | (62) | (140) | (78) | ||||||||||||||
Adjusted Income | $ | 185 | $ | 419 | $ | 233 | |||||||||||
| Diluted shares outstanding | 70 | 71 | 72 | ||||||||||||||
| Adjusted Diluted EPS | $ | 2.65 | $ | 5.88 | $ | 3.22 | |||||||||||
1We estimate a normalized effective tax rate of approximately 25%, reflecting the blended federal, state, and generally higher foreign tax rates applicable to our operations, though this rate may vary depending on our actual geographic mix of income and any unforeseen factors such as changes in tax legislation.
36
OUR OPERATING RESULTS
The Company conducts business through three operating segments: Siding, OSB, and LP South America (LPSA). In the fourth quarter of 2025, the Company determined that LPSA did not meet the reportable segment criteria and beginning with the fourth quarter of 2025, the financial information for the LPSA operating segment is included in Other. These changes had no impact on our consolidated results of operations or financial position. Prior period segment information has been recast to conform to our current presentation. Our other operating segments, Siding and OSB remain reportable operating segments. Other now comprises our South American operations and other products that are not individually significant. See “Note 15 - Segment Information” of the Notes to the Consolidated Financial Statements included in Item 8 of this annual report on Form 10-K for further information regarding our reportable segments. The results of operations for each of our reporting segments are discussed below, as are results of operations for Other.
Siding
The Siding segment serves diverse end markets with a broad product portfolio of engineered wood siding, trim, soffit, and fascia. Our Siding is offered primed (LP® SmartSide® Trim & Siding, LP BuilderSeries® Lap Siding, and LP® Outdoor Building Solutions®) and pre-finished (LP® SmartSide® ExpertFinish® Trim & Siding) to meet the needs of builders and installers in new construction and repair and remodeling applications.
Segment net sales and Adjusted EBITDA for this segment were as follows (dollar amounts in millions):
| Year Ended December 31, | Increase | ||||||||||||||||
| 2025 | 2024 | 2025 - 2024 | |||||||||||||||
| Net sales | $ | 1,689 | $ | 1,558 | 8 | % | |||||||||||
| Adjusted EBITDA | 444 | 390 | 14 | % | |||||||||||||
Net sales in this segment by product line were as follows (dollar amounts in millions):
Year Ended December 31, | Increase | ||||||||||||||||
| 2025 | 2024 | 2025 - 2024 | |||||||||||||||
| Siding | $ | 1,679 | $ | 1,549 | 8 | % | |||||||||||
| Other | 10 | 9 | 8 | % | |||||||||||||
| Total | $ | 1,689 | $ | 1,558 | |||||||||||||
Percent changes in average net sales price and unit shipments were as follows:
2025 versus 2024 | |||||||||||
| Average Selling Price | Unit Shipments | ||||||||||
| Siding | 4 | % | 4 | % | |||||||
Siding net sales increased for the year ended December 31, 2025 due to higher sales volumes and selling prices. Increases in the average sales price were primarily due to a combination of list price increases and favorable mix. ExpertFinish accounted for 10% of sales volume and 16% of net sales for the year ended December 31, 2025, contributing significantly to this favorable mix.
For the year ended December 31, 2025, Adjusted EBITDA increased $54 million compared to prior-year. This growth was driven by higher sales volume and higher selling prices of $91 million, partially offset by strategic investments in sales and marketing of $11 million, a $9 million increase of selling, general, and administrative expenses, $7 million of mill overhead and inventory absorption, and $7 million of tariff expenses.
37
OSB
The OSB segment manufactures and distributes OSB structural panel products, including the innovative value-added OSB product portfolio known as LP® Structural Solutions (which includes LP® FlameBlock® Fire-Rated Sheathing, LP WeatherLogic® Air & Water Barrier, LP® TechShield® Radiant Barrier, LP Legacy® Premium Sub-Flooring, and LP® TopNotch® 350 Durable Sub-Flooring). Significant cost inputs to produce OSB (including approximate breakdown percentages for 2025) were as follows: wood fiber (26%), resin and wax (20%), labor and burden (20%), utilities (5%), and other manufacturing costs (29%).
Segment net sales and Adjusted EBITDA for this segment were as follows (dollar amounts in millions):
Year Ended December 31, | Decrease | ||||||||||||||||
| 2025 | 2024 | 2025 - 2024 | |||||||||||||||
| Net sales | $ | 832 | $ | 1,184 | (30) | % | |||||||||||
| Adjusted EBITDA | 7 | 298 | (98) | % | |||||||||||||
Net sales in this segment by product line were as follows (dollar amounts in millions):
Year Ended December 31, | Decrease | ||||||||||||||||
| 2025 | 2024 | 2025 - 2024 | |||||||||||||||
| OSB - Structural Solutions | $ | 472 | $ | 650 | (27) | % | |||||||||||
| OSB - Commodity | 347 | 514 | (33) | % | |||||||||||||
| Other | 13 | 20 | (33) | % | |||||||||||||
| Total | $ | 832 | $ | 1,184 | |||||||||||||
Percent changes in average net sales prices and unit shipments were as follows:
2025 versus 2024 | |||||||||||
| Average Selling Price | Unit Shipments | ||||||||||
| OSB - Structural Solutions | (19) | % | (10) | % | |||||||
| OSB - Commodity | (26) | % | (8) | % | |||||||
For the year ended December 31, 2025, net sales decreased by $352 million due to a $260 million decrease in OSB prices and an $84 million decrease in sales volumes.
Adjusted EBITDA for the year ended December 31, 2025 decreased year-over-year by $291 million, due to lower average prices and sales volumes.
Other
Our other operations include our LPSA business that manufactures and distributes OSB structural panels and siding products in South America and certain export markets. Previously, all LPSA activity was presented as a separate reportable segment. Financial information related to LPSA is now included in Other. Additionally, Other includes unallocated corporate expenses, such as general administrative costs and stock-based compensation, along with other minor products, services, and closed operations that do not meet the criteria for discontinued operations.
For the year ended December 31, 2025, net sales and Adjusted EBITDA decreased year over year by $12 million and $15 million, respectively.
38
GENERAL CORPORATE AND OTHER EXPENSE, NET
General corporate and other expenses are primarily comprised of corporate overhead unrelated to business activities such as wages and benefits, professional fees, insurance, and other expenses for corporate functions, including executive officers, public company activities, tax, internal audits, and other corporate functions. General corporate and other expense, net, was $51 million in 2025, as compared to $46 million in 2024. This increase was driven by an increase in stock compensation expense.
LOSS ON IMPAIRMENTS
During 2025, we recorded $44 million of non-cash, pre-tax impairment charges. These charges included $24 million related to equipment that will not be utilized in future operations, $13 million related to the expiration and non-renewal of certain timber licenses, $4 million related to property, plant, and equipment associated with a facility closure, and $2 million primarily related to an operating lease asset associated with a previously closed facility. During 2024, we recorded $5 million of non-cash, pre-tax impairment charges related to property, plant, and equipment that will not be utilized in future operations. See further discussion in “Note 11 - Impairment of Long-Lived Assets” and “Note 1 - Summary of Significant Accounting Policies” of the Notes to the Consolidated Financial Statements included in Item 8 of this annual report on Form 10-K.
OTHER OPERATING CREDITS AND CHARGES, NET
For a discussion of other operating credits and charges, net, see “Note 10 - Other Operating and Non-Operating Income (Expense)” of the Notes to the Consolidated Financial Statements included in Item 8 of this annual report on Form 10-K.
NON-OPERATING INCOME (EXPENSE)
For a discussion of non-operating income (expense), see “Note 10 - Other Operating and Non-Operating Income (Expense)” of the Notes to the Consolidated Financial Statements included in Item 8 of this annual report on Form 10-K.
INCOME TAXES
We recognized a tax provision of $50 million in 2025, as compared to $140 million in 2024. For 2025, the primary differences between the U.S. statutory rate of 21% and the effective rate was related to state and foreign income taxes, partially offset by changes in uncertain tax positions. For 2024, the primary difference between the U.S. statutory rate of 21% and the effective tax rate was related to state and foreign income taxes. See “Note 6 – Income Taxes” of the Notes to the Consolidated Financial Statements included in Item 8 of this annual report on Form 10-K for further discussion. We paid $42 million and $124 million of income taxes net of refunds in 2025 and 2024, respectively.
LEGAL AND ENVIRONMENTAL MATTERS
For a discussion of legal and environmental matters involving us and the potential impact thereof on our financial position, results of operations, and cash flows, see Item 3 in this annual report on Form 10-K as well as “Note 12 - Commitments and Contingencies” of the Notes to the Consolidated Financial Statements included in Item 8 of this annual report on Form 10-K.
39
LIQUIDITY AND CAPITAL RESOURCES
Overview
Our principal sources of liquidity are existing cash and investment balances, cash generated by our operations, and our ability to borrow under such credit facilities as we may have in effect from time to time. We assess our liquidity in terms of our ability to generate cash to fund our short- and long-term cash requirements. As such, we project our anticipated cash requirements as well as cash flows generated from operating activities to meet those needs. We anticipate long-term cash uses may also include strategic acquisitions. On a long-term basis, we will continue to rely on our credit facility for any long-term funding not provided by operating cash flows. We may also, from time to time, issue and sell equity, debt, or hybrid securities or engage in other capital market transactions.
Our principal uses of liquidity are paying the costs and expenses associated with our operations, servicing outstanding indebtedness, paying dividends, and making capital expenditures. We may also, from time to time, prepay or repurchase outstanding indebtedness or shares or acquire assets or businesses that are complementary to our operations. Any such repurchases may be commenced, suspended, discontinued, or resumed, and the method or methods of affecting any such repurchases may be changed at any time, or from time to time, without prior notice.
Operating Activities
During 2025, we generated $382 million of cash from operations, as compared to $605 million in 2024. The decrease in cash provided by operations was primarily related to lower net income. At December 31, 2025 and 2024, we had working capital of $227 million and $216 million, respectively.
Investing Activities
During 2025, net cash used for investing activities was $291 million, as compared to $183 million in 2024. Capital expenditures for the year ended December 31, 2025, and 2024, were $291 million and $183 million, respectively, primarily related to siding conversion expenditures and growth and maintenance capital.
During 2024, we received $16 million in proceeds from our share of the sale of certain assets from an equity method investment. We also paid $17 million for an equity method investment in South America.
Capital expenditures in 2026 are expected to be approximately $400 million. We expect to fund our short-term and long-term capital expenditures in 2026 through cash on hand, cash generated from operations, and available borrowing under our Amended Credit Facility, as necessary.
Financing Activities
During 2025, cash used in financing activities was $141 million. We paid cash dividends of $78 million and $61 million to repurchase shares of LP common stock under the 2024 Share Repurchase Program during the year ended December 31, 2025. The remaining financing activities were primarily related to income tax withholding requirements associated with our employee stock-based compensation plans.
During 2024, cash used in financing activities was $292 million. We paid cash dividends of $74 million and $212 million to repurchase shares of LP common stock under the share repurchase programs authorized by LP's Board of Directors in 2022 and 2024, respectively, during the year ended December 31, 2024. The remaining financing activities were primarily related to income tax withholding requirements associated with our employee stock-based compensation plans.
40
CREDIT FACILITIES
In November 2022, LP entered into a Second Amended and Restated Credit Agreement with American AgCredit, PCA, as administrative agent and sole lead arranger, CoBank, ACB, as letter of credit issuer, and certain other lender parties (the Credit Agreement), relating to its revolving credit facility. On March 26, 2025, LP entered into the First Amendment to Second Amended and Restated Credit Agreement (the First Amendment) with American AgCredit, PCA, as administrative agent, CoBank, ACB, as letter of credit issuer, and the lenders and voting participants party thereto, which amended the Credit Agreement (the Amended Credit Agreement) to (1) increase the aggregate principal amount for the credit facility (the Amended Credit Facility) from $550 million to $750 million, (2) increase the sub-limit for letters of credit from $60 million to $75 million, (3) change the interest rate for revolving borrowing, (4) change the capitalization ratio limit, and (5) extend the maturity date to March 26, 2032. As of December 31, 2025, we had no outstanding borrowings pursuant to the Amended Credit Facility.
The Amended Credit Agreement contains various restrictive covenants and customary events of default, the occurrence of which could result in the acceleration of our obligation to repay the indebtedness outstanding thereunder. The Amended Credit Agreement also contains certain financial covenants that, among other things, require us and our consolidated subsidiaries to have, as of the end of each fiscal quarter, a capitalization ratio (i.e., funded debt less unrestricted cash to total capitalization) of no more than 65%. As of December 31, 2025, we were in compliance with all financial covenants under the Amended Credit Agreement.
In May 2024, LP entered into a new letter of credit facility agreement (the LOC Facility Agreement), replacing the letter of credit facility agreement dated May 2020. The LOC Facility Agreement provides for the funding of letters of credit up to an aggregate outstanding amount of $20 million, which may be secured by certain cash collateral of LP (the Letter of Credit Facility). The LOC Facility Agreement provides for a letter of credit fee, due quarterly, ranging from 1.000% to 1.875% of the daily available amount to be drawn on each letter of credit issued under the Letter of Credit Facility. The LOC Facility Agreement contains similar affirmative, negative, and financial covenants as those set forth in the Amended Credit Agreement, including the capitalization ratio covenant. All amounts outstanding under the Letter of Credit Facility become due on April 15, 2029. As of December 31, 2025, we were in compliance with all financial covenants under the Letter of Credit Facility.
OTHER LIQUIDITY MATTERS
2029 Senior Notes
In March 2021, we issued the 3.625% Senior Notes due in 2029 in the aggregate principal amount of $350 million, which mature on March 15, 2029 (the 2029 Senior Notes). As of December 31, 2025, future interest payments associated with the 2029 Senior Notes totaled $41 million, with $13 million payable within 12 months of such date. For additional information regarding the 2029 Senior Notes, please see “Note 8 - Long-Term Debt” of the Notes to the Consolidated Financial Statements included in Item 8 of this annual report on Form 10-K.
Contingency Reserves
Contingency reserves, which represent an estimate of future cash needs for various contingencies (principally, environmental reserves), totaled $27 million at December 31, 2025, of which $1 million is estimated to be payable within one year of such date. There is inherent uncertainty concerning the reliability and precision of such estimates, and as such, the amounts ultimately paid in resolving these contingencies could exceed the current reserves by a material amount.
Leases
We have lease arrangements for real estate, mobile equipment at our manufacturing facilities, rail cars to transport our products, and a fleet of vehicles. As of December 31, 2025, we had fixed lease payment obligations of $32 million, with $10 million payable within 12 months of such date.
Other Purchase Obligations
Our other purchase obligations primarily consist of obligations related to information technology infrastructure. As of December 31, 2025, we had other purchase obligations of $39 million, with $22 million payable within 12 months of such date.
41
Off-Balance Sheet Arrangements
As of December 31, 2025, we had standby letters of credit of $14 million outstanding related to collateral for environmental impact on owned properties, a deposit for forestry license, and insurance collateral, including workers’ compensation.
Potential Impairments
For a discussion of potential impairments, see “Note 11 - Impairment of Long-Lived Assets” and “Note 1 - Summary of Significant Accounting Policies” of the Notes to the Consolidated Financial Statements included in Item 8 of this annual report on Form 10-K.
PROSPECTIVE ACCOUNTING PRONOUNCEMENTS
For a discussion of prospective accounting pronouncements, see “Note 2 - Present and Prospective Accounting Pronouncements” of the Notes to the Consolidated Financial Statements included in Item 8 of this annual report on Form 10-K.
ITEM 7A. Quantitative and Qualitative Disclosures About Market Risk
We are exposed to fluctuations in foreign currency exchange rates, commodity prices and interest rates which could impact our results of operations and financial condition.
Foreign Currency Risk
Each of our international operations has transactional foreign currency exposures related to buying and selling in currencies other than the local currencies in which it operates. Exposures are primarily related to the U.S. dollar relative to the Canadian dollar, the Brazilian real, the Chilean peso, and the Argentine Peso. We also have translation exposure resulting from translating the financial statements of foreign subsidiaries into U.S. dollars. Although we have in the past entered into foreign exchange contracts associated with certain of our indebtedness and may continue to enter into foreign exchange contracts associated with major equipment purchases to manage a portion of the foreign currency rate risk, we historically have not entered into currency rate hedges with respect to our exposure from operations, provided we may do so in the future.
Commodity Price Risk
Some of our products are sold as commodities, and therefore sales prices fluctuate daily based on market factors over which we have little or no control. The most significant commodity product we sell is OSB. Based upon an assumed North America annual production capacity in the OSB segment of 4.1 billion square feet (3/8” basis) or 3.5 billion square feet (7/16” basis), a $1 change in the annual average price per thousand square feet on 7/16” basis would change annual pre-tax profits by approximately $4 million.
We historically have not entered into material commodity futures and swaps, although we may do so in the future.
Interest Rate Risk
We could be exposed to market risk associated with changes in interest rates on our variable rate credit facility. As of December 31, 2025, there were no outstanding borrowings pursuant to the Amended Credit Facility. We do not currently have any derivative or hedging arrangements, or other known exposures, to changes in interest rates. Based on our current amounts outstanding, a 100-basis point increase or decrease in market interest rates over a 12-month period would not result in a change to interest expense.
42
ITEM 8. Financial Statements and Supplementary Data
REPORT OF INDEPENDENT REGISTERED PUBLIC ACCOUNTING FIRM
To the stockholders and the Board of Directors of Louisiana-Pacific Corporation
Opinion on the Financial Statements
We have audited the accompanying consolidated balance sheets of Louisiana-Pacific Corporation and subsidiaries (the “Company”) as of December 31, 2025 and 2024, the related consolidated statements of income, comprehensive income, cash flows, and stockholders’ equity, for each of the three years in the period ended December 31, 2025, and the related notes (collectively referred to as the “financial statements”). In our opinion, the financial statements present fairly, in all material respects, the financial position of the Company as of December 31, 2025 and 2024, and the results of its operations and its cash flows for each of the three years in the period ended December 31, 2025, in conformity with accounting principles generally accepted in the United States of America.
We have also audited, in accordance with the standards of the Public Company Accounting Oversight Board (United States) (PCAOB), the Company’s internal control over financial reporting as of December 31, 2025, based on criteria established in Internal Control — Integrated Framework (2013) issued by the Committee of Sponsoring Organizations of the Treadway Commission and our report dated February 17, 2026, expressed an unqualified opinion on the Company’s internal control over financial reporting.
Basis for Opinion
These financial statements are the responsibility of the Company’s management. Our responsibility is to express an opinion on the Company’s financial statements based on our audits. We are a public accounting firm registered with the PCAOB and are required to be independent with respect to the Company in accordance with the U.S. federal securities laws and the applicable rules and regulations of the Securities and Exchange Commission and the PCAOB.
We conducted our audits in accordance with the standards of the PCAOB. Those standards require that we plan and perform the audit to obtain reasonable assurance about whether the financial statements are free of material misstatement, whether due to error or fraud. Our audits included performing procedures to assess the risks of material misstatement of the financial statements, whether due to error or fraud, and performing procedures that respond to those risks. Such procedures included examining, on a test basis, evidence regarding the amounts and disclosures in the financial statements. Our audits also included evaluating the accounting principles used and significant estimates made by management, as well as evaluating the overall presentation of the financial statements. We believe that our audits provide a reasonable basis for our opinion.
Critical Audit Matter
The critical audit matter communicated below is a matter arising from the current-period audit of the financial statements that was communicated or required to be communicated to the audit committee and that (1) relates to accounts or disclosures that are material to the financial statements and (2) involved our especially challenging, subjective, or complex judgments. The communication of critical audit matters does not alter in any way our opinion on the financial statements, taken as a whole, and we are not, by communicating the critical audit matter below, providing a separate opinion on the critical audit matter or on the accounts or disclosures to which it relates.
Revenue — Refer to Note 3 to the Financial Statements
Critical Audit Matter Description
The Company’s revenue consists of product sales and is recognized when obligations under the terms of a contract (i.e., purchase order) with the Company’s customers are satisfied. Revenue is measured as the amount of consideration the Company expects to receive in exchange for transferring goods.
43
Auditing revenue required a significant extent of effort and the involvement of professionals with expertise in information technology (“IT”) necessary for us to identify, test, and evaluate the Company’s system and automated controls.
How the Critical Audit Matter Was Addressed in the Audit
Our audit procedures related to the Company’s revenue transactions included the following, among others:
•With the assistance of our IT specialists, we:
•Identified the significant system used to process revenue transactions and tested the general IT controls over the system, including testing of user access controls, change management controls, and IT operations controls.
•Performed testing of automated controls within the relevant revenue streams, as well as the controls designated to ensure the accuracy and completeness of revenue.
•We tested the design and operating effectiveness of internal controls within the relevant revenue business processes.
•With the assistance of our data specialists, we created data visualizations to evaluate recorded revenue and evaluate trends in the transactional revenue data.
•For a sample of revenue transactions, we performed detail transaction testing by agreeing the amounts recognized to source documents and testing the mathematical accuracy of the recorded revenue.
•With the assistance of our data specialists, we performed a reconciliation of all automated revenue transactions recorded in the system, and for a sample of revenue transactions within the population, traced the transaction from the testing performed to the respective journal entry data.
/s/ Deloitte & Touche LLP
February 17, 2026
We have served as the Company’s auditor since 1997.
44
Consolidated Statements of Income
Amounts in millions, except per share
Year Ended December 31, | |||||||||||||||||
2025 | 2024 | 2023 | |||||||||||||||
| Net sales | $ | $ | $ | ||||||||||||||
| Cost of sales | ( | ( | ( | ||||||||||||||
| Gross profit | |||||||||||||||||
| Selling, general, and administrative expenses | ( | ( | ( | ||||||||||||||
| Loss on impairments | ( | ( | ( | ||||||||||||||
| Other operating credits and charges, net | ( | ( | ( | ||||||||||||||
| Income from operations | |||||||||||||||||
| Interest expense | ( | ( | ( | ||||||||||||||
| Investment income | |||||||||||||||||
Other non-operating (expense) income | ( | ( | |||||||||||||||
| Income before income taxes | |||||||||||||||||
| Provision for income taxes | ( | ( | ( | ||||||||||||||
Equity in unconsolidated affiliates | |||||||||||||||||
| Net income | $ | $ | $ | ||||||||||||||
| Net income per share of common stock: | |||||||||||||||||
| Basic | $ | $ | $ | ||||||||||||||
| Diluted | $ | $ | $ | ||||||||||||||
| Average shares of common stock used to compute net income per share: | |||||||||||||||||
| Basic | |||||||||||||||||
| Diluted | |||||||||||||||||
See Notes to the Consolidated Financial Statements.
45
Consolidated Statements of Comprehensive Income
Amounts in millions
Year Ended December 31, | |||||||||||||||||
2025 | 2024 | 2023 | |||||||||||||||
| Net income | $ | $ | $ | ||||||||||||||
| Other comprehensive income (loss), net of tax | |||||||||||||||||
| Foreign currency translation adjustments | ( | ||||||||||||||||
| Changes in defined benefit pension plans | |||||||||||||||||
| Other comprehensive income (loss), net of tax | ( | ||||||||||||||||
| Comprehensive income | $ | $ | $ | ||||||||||||||
See Notes to the Consolidated Financial Statements.
46
Consolidated Balance Sheets
Amounts in millions, except per share amounts
| December 31, | |||||||||||
2025 | 2024 | ||||||||||
| ASSETS | |||||||||||
| Cash and cash equivalents | $ | $ | |||||||||
Receivables, net of allowance for doubtful accounts of $ | |||||||||||
| Inventories | |||||||||||
| Prepaid expenses and other current assets | |||||||||||
| Total current assets | |||||||||||
| Property, plant, and equipment, net | |||||||||||
| Timber and timberlands | |||||||||||
| Operating lease assets, net | |||||||||||
| Goodwill and intangible assets | |||||||||||
| Investments in and advances to affiliates | |||||||||||
| Other assets | |||||||||||
| Deferred tax assets | |||||||||||
| Total assets | $ | $ | |||||||||
| LIABILITIES AND STOCKHOLDERS' EQUITY | |||||||||||
| Accounts payable and accrued liabilities | $ | $ | |||||||||
| Income taxes payable | |||||||||||
| Total current liabilities | |||||||||||
| Long-term debt | |||||||||||
| Deferred income taxes | |||||||||||
| Non-current operating lease liabilities | |||||||||||
| Contingency reserves, excluding current portion | |||||||||||
| Other long-term liabilities | |||||||||||
| Total liabilities | |||||||||||
Commitments and contingencies (Note 12) | |||||||||||
| Stockholders’ equity: | |||||||||||
Preferred stock, $ | |||||||||||
Common stock, $ | |||||||||||
| Additional paid-in capital | |||||||||||
| Retained earnings | |||||||||||
Treasury stock, | ( | ( | |||||||||
| Accumulated comprehensive loss | ( | ( | |||||||||
| Total stockholders’ equity | |||||||||||
| Total liabilities and stockholders’ equity | $ | $ | |||||||||
See Notes to the Consolidated Financial Statements.
47
Consolidated Statements of Cash Flows
Amounts in millions
| Year Ended December 31, | |||||||||||||||||
2025 | 2024 | 2023 | |||||||||||||||
| CASH FLOWS FROM OPERATING ACTIVITIES: | |||||||||||||||||
| Net income | $ | $ | $ | ||||||||||||||
| Adjustments to net income: | |||||||||||||||||
| Depreciation and amortization | |||||||||||||||||
| Impairment of goodwill and long-lived assets | |||||||||||||||||
| Stock-based compensation expense | |||||||||||||||||
| Pension loss due to settlement | |||||||||||||||||
| Deferred taxes | ( | ||||||||||||||||
| Foreign currency remeasurement and transaction losses | |||||||||||||||||
| Other adjustments, net | ( | ||||||||||||||||
| Changes in assets and liabilities (net of acquisitions and divestitures): | |||||||||||||||||
| Receivables | ( | ||||||||||||||||
| Inventories | ( | ( | |||||||||||||||
| Prepaid expenses and other current assets | ( | ( | |||||||||||||||
| Accounts payable and accrued liabilities | ( | ( | |||||||||||||||
| Income taxes payable, net of receivables | ( | ( | |||||||||||||||
| Net cash provided by operating activities | |||||||||||||||||
| CASH FLOWS FROM INVESTING ACTIVITIES: | |||||||||||||||||
| Property, plant, and equipment additions | ( | ( | ( | ||||||||||||||
| Acquisition of facility assets | ( | ||||||||||||||||
| Proceeds from sale of assets | |||||||||||||||||
| Investment in affiliates | ( | ||||||||||||||||
| Other investing activities, net | ( | ||||||||||||||||
| Net cash used in investing activities | ( | ( | ( | ||||||||||||||
| CASH FLOWS FROM FINANCING ACTIVITIES: | |||||||||||||||||
| Repayment of long-term debt | ( | ||||||||||||||||
| Borrowing of long-term debt | |||||||||||||||||
| Payment of cash dividends | ( | ( | ( | ||||||||||||||
| Purchase of stock | ( | ( | |||||||||||||||
| Other financing activities | ( | ( | ( | ||||||||||||||
| Net cash used in financing activities | ( | ( | ( | ||||||||||||||
| EFFECT OF EXCHANGE RATE ON CASH, CASH EQUIVALENTS, AND RESTRICTED CASH | ( | ( | |||||||||||||||
| Net increase (decrease) in cash, cash equivalents, and restricted cash | ( | ( | |||||||||||||||
| Cash, cash equivalents, and restricted cash at beginning of period | |||||||||||||||||
| Cash, cash equivalents, and restricted cash at end of period | $ | $ | $ | ||||||||||||||
| Supplemental cash flow information: | |||||||||||||||||
| Cash paid for income taxes, net | $ | ( | $ | ( | $ | ( | |||||||||||
| Cash paid for interest, net | $ | ( | $ | ( | $ | ( | |||||||||||
| Unpaid capital expenditures | $ | $ | $ | ||||||||||||||
See Notes to the Consolidated Financial Statements.
48
Consolidated Statements of Stockholders’ Equity
Amounts in millions, except per share amounts
| Common Stock | Treasury Stock | Additional Paid-In Capital | Retained Earnings | Accumulated Comprehensive Income (Loss) | Total Stockholders’ Equity | ||||||||||||||||||||||||||||||||||||||||||
| Shares | Amount | Shares | Amount | ||||||||||||||||||||||||||||||||||||||||||||
Balance as of December 31, 2022 | $ | $ | ( | $ | $ | $ | ( | $ | |||||||||||||||||||||||||||||||||||||||
| Net income | — | — | — | — | — | — | |||||||||||||||||||||||||||||||||||||||||
Cash dividends on common stock paid ($ | — | — | — | — | — | ( | — | ( | |||||||||||||||||||||||||||||||||||||||
| Issuance of shares under stock plans | — | — | ( | ( | — | — | |||||||||||||||||||||||||||||||||||||||||
| Taxes paid on net settlement | — | — | — | ( | — | — | — | ( | |||||||||||||||||||||||||||||||||||||||
| Purchase of stock | — | — | |||||||||||||||||||||||||||||||||||||||||||||
| Compensation expense associated with stock-based compensation | — | — | — | — | — | — | |||||||||||||||||||||||||||||||||||||||||
| Other comprehensive income | — | — | — | — | — | — | |||||||||||||||||||||||||||||||||||||||||
Balance as of December 31, 2023 | ( | ( | |||||||||||||||||||||||||||||||||||||||||||||
| Net income | — | — | — | — | — | — | |||||||||||||||||||||||||||||||||||||||||
Cash dividends on common stock paid ($ | — | — | — | — | — | ( | — | ( | |||||||||||||||||||||||||||||||||||||||
| Issuance of shares under stock plans | — | — | ( | — | — | ||||||||||||||||||||||||||||||||||||||||||
| Taxes paid on net settlement | — | — | — | ( | — | — | — | ( | |||||||||||||||||||||||||||||||||||||||
| Purchase of stock | ( | ( | — | ( | — | ( | |||||||||||||||||||||||||||||||||||||||||
| Compensation expense associated with stock-based compensation | — | — | — | — | — | — | |||||||||||||||||||||||||||||||||||||||||
| Other comprehensive loss | — | — | — | — | — | — | ( | ( | |||||||||||||||||||||||||||||||||||||||
Balance as of December 31, 2024 | ( | ( | |||||||||||||||||||||||||||||||||||||||||||||
| Net income | — | — | — | — | — | — | |||||||||||||||||||||||||||||||||||||||||
Cash dividends on common stock paid ($ | — | — | — | — | — | ( | — | ( | |||||||||||||||||||||||||||||||||||||||
| Issuance of shares under stock plans | — | — | — | ||||||||||||||||||||||||||||||||||||||||||||
| Taxes paid on net settlement | — | — | — | ( | — | — | — | ( | |||||||||||||||||||||||||||||||||||||||
| Purchase of stock | ( | ( | — | ( | — | ( | |||||||||||||||||||||||||||||||||||||||||
| Compensation expense associated with stock-based compensation | — | — | — | — | — | — | |||||||||||||||||||||||||||||||||||||||||
| Other comprehensive income | — | — | — | — | — | — | |||||||||||||||||||||||||||||||||||||||||
Balance as of December 31, 2025 | $ | $ | ( | $ | $ | $ | ( | $ | |||||||||||||||||||||||||||||||||||||||
See Notes to the Consolidated Financial Statements.
49
INDEX TO THE NOTES TO THE CONSOLIDATED FINANCIAL STATEMENTS
| Note: | Description | Page No. | ||||||
Note 1 | ||||||||
Note 2 | ||||||||
Note 3 | ||||||||
Note 4 | ||||||||
Note 5 | ||||||||
Note 6 | ||||||||
Note 7 | ||||||||
Note 8 | ||||||||
Note 9 | ||||||||
Note 10 | ||||||||
Note 11 | ||||||||
Note 12 | ||||||||
Note 13 | ||||||||
Note 14 | ||||||||
Note 15 | ||||||||
50
NOTES TO THE CONSOLIDATED FINANCIAL STATEMENTS
1. SUMMARY OF SIGNIFICANT ACCOUNTING POLICIES
Nature of Operations
Louisiana-Pacific Corporation and our subsidiaries are a leading provider of high-performance building solutions that meet the demands of builders, remodelers, and homeowners worldwide. Serving the new home construction, repair and remodeling, and outdoor structures markets, we have leveraged our expertise to become an industry leader known for innovation, quality, reliability, and sustainability. The principal customers for our building solutions are retailers, wholesalers, and home building and industrial businesses in North America and South America. The Company operates more than 20 manufacturing facilities across North and South America, and operates an additional facility through a joint venture. References to “LP,” the “Company,” “we,” “our,” and “us” refer to Louisiana-Pacific Corporation and its consolidated subsidiaries as a whole.
See “Note 15 - Segment Information” below for information regarding our products and segments.
Basis of Presentation
The accompanying Consolidated Financial Statements have been prepared in accordance with U.S. GAAP. The preparation of financial statements in conformity with U.S. GAAP requires management to make estimates and assumptions that affect the amounts reported in the Consolidated Financial Statements and accompanying notes. Actual results could differ from those estimates.
The Consolidated Financial Statements include the accounts of LP and our controlled subsidiaries. All intercompany transactions, profits, and balances have been eliminated. All dollar amounts are in millions except per share amounts.
Certain reclassifications have been made to prior years to conform to the current year presentation.
Cash and Cash Equivalents
Cash and cash equivalents include cash on hand and short-term investments of three months or less when purchased. These investments are stated at cost, which approximates market value.
Receivables
Receivables consisted of the following (dollar amounts in millions):
| December 31, | |||||||||||
2025 | 2024 | ||||||||||
| Trade receivables | $ | $ | |||||||||
| Income tax receivables | |||||||||||
| Other receivables | |||||||||||
| Allowance for doubtful accounts | ( | ( | |||||||||
| Total Receivables | $ | $ | |||||||||
Trade receivables are primarily generated by sales of our products to our wholesale and retail customers. Other receivables at December 31, 2025 and 2024 primarily consisted of sales tax receivables and other miscellaneous receivables.
51
Fair Value Measurements
Fair value is defined as the exchange price that would be received for an asset or paid to transfer a liability (an exit price) in the principal or most advantageous market for the asset or liability in an orderly transaction between market participants on the measurement date. The fair value hierarchy requires an entity to maximize the use of observable inputs and minimize the use of unobservable inputs when measuring fair value. We are required to classify these financial assets and liabilities into two groups: (1) recurring, measured on a periodic basis, and (2) non-recurring, measured on an as-needed basis.
There are three levels of inputs that may be used to measure fair value:
Level 1 Unadjusted quoted prices in active markets that are accessible at the measurement date for identical, unrestricted assets or liabilities.
Level 2 Quoted prices for similar assets or liabilities in active markets; quoted prices for identical or similar assets or liabilities in inactive markets; or valuations based on models where the significant inputs are observable or can be corroborated by observable market data.
Level 3 Valuations based on models where significant inputs are not observable. Unobservable inputs are used when little or no market data is available and reflect the Company’s own assumptions about the assumptions market participants would use.
The Company’s financial instruments consist of cash and cash equivalents, short-term receivables, trade payables, debt instruments, and trading securities. Carrying amounts reported on the balance sheet for cash and cash equivalents, receivables, and accounts payable approximate fair value due to the short-term maturity of these instruments. See “Note 8 - Long Term Debt” below for further information regarding the fair value of long-term debt instruments.
Trading securities consist of rabbi trust financial assets, which are recorded in other assets in our Consolidated Balance Sheets. The rabbi trust holds assets attributable to the elections of certain management employees to defer the receipt of a portion of their compensation. The assets of the rabbi trust are invested in mutual funds and are reported at fair value based on active market quotations, which represent Level 1 inputs.
Inventories
| December 31, | |||||||||||
2025 | 2024 | ||||||||||
| Logs | $ | $ | |||||||||
| Other raw materials | |||||||||||
| Semi-finished inventory | |||||||||||
| Finished products | |||||||||||
| Total Inventories | $ | $ | |||||||||
52
Property, Plant, and Equipment
Property, plant, and equipment, including capitalized interest, are recorded at cost and consisted of the following (dollar amounts in millions):
| December 31, | |||||||||||
2025 | 2024 | ||||||||||
| Land, land improvements, and logging roads, net of road amortization | $ | $ | |||||||||
| Buildings | |||||||||||
| Machinery and equipment | |||||||||||
| Construction in progress | |||||||||||
| Property, plant, and equipment | |||||||||||
| Accumulated depreciation | ( | ( | |||||||||
| Property, plant, and equipment, net | $ | $ | |||||||||
Depreciation is calculated on a straight-line basis over the estimated useful lives of the assets, which typically range from 5 to 20 years for buildings and land improvements, 3 to 15 years for machinery and equipment, and the shorter of the lease terms or estimated useful lives for leasehold improvements.
Depreciation and amortization expense on property, plant, and equipment was included in our Consolidated Statements of Income as noted below (dollar amounts in millions):
Year Ended December 31, | |||||||||||||||||
2025 | 2024 | 2023 | |||||||||||||||
| Cost of sales | $ | $ | $ | ||||||||||||||
| Selling, general and administrative expenses | |||||||||||||||||
| Total depreciation and amortization | $ | $ | $ | ||||||||||||||
Logging road construction costs are capitalized and included in land and land improvements. These costs are amortized as the timber volume adjacent to the road system is harvested.
Long-lived assets to be held and used (primarily property, plant, and equipment and timber and timberlands) are reviewed for impairment when events or changes in circumstances indicate that the carrying amount of the assets may not be recoverable. When impairment is indicated, the book values of the assets are written down to their estimated fair value as calculated by the expected discounted cash flow or estimated net sales price. See “Note 11 - Impairment of Long-Lived Assets” below for a discussion of charges related to impairments of property, plant, and equipment.
Long-lived assets that are held for sale are written down to the estimated sales proceeds less cost to sell unless the estimated net proceeds exceed the carrying value.
53
Goodwill and Intangible Assets
Goodwill and indefinite-lived intangible assets are assessed annually for impairment during the fourth quarter or earlier upon the occurrence of certain events or substantive changes in circumstances. In accordance with Accounting Standards Codification (ASC) 350, Intangibles – Goodwill and Other, companies may opt to first assess qualitative factors to determine whether it is more likely than not that the fair value of a reporting unit is less than its carrying amount. A qualitative assessment includes factors such as financial performance, industry and market metrics, and other factors affecting the reporting unit. If this assessment concludes that it is more likely than not that the fair value of a reporting unit exceeds its carrying value, then goodwill is not considered impaired, and no further impairment testing is required. Conversely, if the qualitative assessment concludes that it is more likely than not that the fair value of a reporting unit is less than its carrying value, we must then compare the fair value of the reporting unit to its carrying value. Impairment is evaluated by applying a fair value-based test. Impairment losses would be recognized when the quantitative assessment concludes that the carrying amount exceeds the fair value of the reporting unit, limited to the carrying amount of goodwill. No impairment charges were recognized for the year ended December 31, 2025, 2024, and 2023.
Changes in goodwill and intangible assets for the years ended December 31, 2025 and 2024, are provided in the following table (dollar amounts in millions):
Goodwill | Developed Technology | Total Goodwill and Intangibles | |||||||||||||||
Balance at December 31, 2023 | $ | 19 | $ | 7 | $ | 27 | |||||||||||
| Additions | — | — | — | ||||||||||||||
| Impairment | — | — | — | ||||||||||||||
| Amortization | — | (1) | (1) | ||||||||||||||
Balance at December 31, 2024 | 19 | 7 | 26 | ||||||||||||||
| Additions | — | — | — | ||||||||||||||
| Impairment | — | — | — | ||||||||||||||
| Amortization | — | (4) | (4) | ||||||||||||||
Balance at December 31, 2025 | $ | 19 | $ | 3 | $ | 22 | |||||||||||
1Timber licenses are included in timber and timberlands on the Consolidated Balance Sheets.
Due to a facility closure in the second quarter of 2025, the Company revised its estimate of the useful lives of its developed technology to better reflect the period over which the asset is expected to be utilized. The developed technology previously had a remaining useful life of ten years and is now being amortized over a revised useful life of one year. This revision in estimate resulted in a quarterly increase of $2 million in amortization expense beginning in the second quarter of 2025. Amortization of the developed technology is expected to be fully recognized in 2026, resulting in $3 million of amortization expense.
Timber and Timberlands
Timber and timberlands are comprised of timber deeds and allocations of the purchase price to Canadian timber harvesting licenses. Timber deeds are transactions in which we purchase timber but not the underlying land. The cost of timber deeds is capitalized in timber and timberlands and charged to the cost of timber harvested as the volume is removed. Timber that has been severed but has not yet been delivered to a facility is included in timber and timberlands. We had timber and timberlands of $5 million and $6 million as of December 31, 2025, and 2024, respectively.
54
Timber licenses have a life of 20 to 25 years and are amortized on a straight-line basis over the life of the agreement. As of December 31, 2025 and 2024, we had timber licenses of $8 million and $23 million, respectively. Certain Canadian timber harvesting licenses also include future requirements for reforestation. The future estimated reforestation obligation is accrued and recognized in cost of sales based on the volume of timber harvested. The obligation is determined by estimating future costs based on various assumptions and judgments, the specific nature of which varies considering the particular facts and circumstances surrounding each reforestation obligation. Subsequent changes to estimates resulting from the passage of time and revisions to calculations are recognized in earnings as they occur. Amortization of timber licenses is expected to be $1 million in 2026 and in each of the subsequent four years.
Changes in timber licenses for the years ended December 31, 2025 and 2024, are provided in the following table (dollar amounts in millions):
Year Ended December 31, | |||||||||||
| 2025 | 2024 | ||||||||||
Beginning Balance | $ | 23 | $ | 25 | |||||||
| Additions | — | 1 | |||||||||
| Impairment | (13) | — | |||||||||
| Amortization | (2) | (3) | |||||||||
Ending Balance | $ | 8 | $ | 23 | |||||||
Investments in Affiliates
Restricted Cash
Our restricted cash accounts generally secure outstanding letters of credit. There were no restricted cash balances as of December 31, 2025 and 2024.
Accounts Payable and Accrued Liabilities
Accounts payable and accrued liabilities were as follows (dollar amounts in millions):
| December 31, | |||||||||||
2025 | 2024 | ||||||||||
| Trade accounts payable | $ | $ | |||||||||
| Salaries and wages payable | |||||||||||
| Accrued customer incentives | |||||||||||
| Taxes other than income taxes | |||||||||||
| Other accrued liabilities | |||||||||||
| Total Accounts payable and accrued liabilities | $ | $ | |||||||||
Other accrued liabilities at December 31, 2025 and 2024, primarily consisted of accrued interest, the short-term portion of warranty reserves, the short-term portion of workers’ compensation liabilities, and other items. Additionally, trade accounts payable included $33 million and $32 million related to capital expenditures that had not yet been paid as of December 31, 2025 and 2024, respectively.
55
Other Long-Term Liabilities
Other long-term liabilities were as follows (dollar amounts in millions):
| December 31, | |||||||||||
2025 | 2024 | ||||||||||
| Post-retirement obligations | $ | $ | |||||||||
| Asset retirement obligations | |||||||||||
| Uncertain tax positions | |||||||||||
| Warranty reserves | |||||||||||
| Pension benefit obligation | |||||||||||
| Other | |||||||||||
| Total Other long-term liabilities | $ | $ | |||||||||
Asset Retirement Obligations
The activity in our asset retirement obligation liability for 2025 and 2024 is summarized in the following table (dollar amounts in millions):
Year Ended December 31, | |||||||||||
2025 | 2024 | ||||||||||
| Beginning balance | $ | $ | |||||||||
| Accretion expense | |||||||||||
| Adjusted to expense (cost of sales and other operating credits and charges, net) | |||||||||||
| Ending balance | $ | $ | |||||||||
Income Taxes
We account for income taxes under an asset and liability approach that requires the recognition of deferred tax assets and liabilities for the expected future tax consequences of events that have been recognized in our Consolidated Financial Statements or tax returns. In estimating future tax consequences, we generally consider all expected future events other than the enactment of changes in tax laws or rates. The effect on deferred tax assets and liabilities of a change in tax rates will be recognized as income or expense in the period that includes the enactment date. Additionally, deferred tax assets are reduced by a valuation allowance when it is more likely than not that some portion of the deferred tax assets will not be realized.
We recognize the effect of income tax positions only if those positions are more likely than not to be sustained. Recognized income tax positions are measured at the largest amount that is greater than 50% likely of being realized. Changes in recognition or measurement are reflected in the period in which the change in judgment occurs.
We classify interest related to income tax liabilities or uncertain tax positions as interest expense or interest income and, if applicable, penalties are recognized as a component of income tax expense.
56
We are subject to global intangible low-taxed income, an incremental tax on foreign income. We have made an accounting election to record this tax in the period the tax arises.
Stock-Based Compensation
We have stock award plans covering certain key employees and directors, which provide for awards of restricted stock units, performance stock units, stock-settled stock appreciation rights (SSARS), and stock options. In addition, we offer an employee stock purchase plan to employees.
Foreign Currency Translation
The functional currency for our Canadian subsidiaries is the U.S. dollar. The books and records for these subsidiaries are maintained in the Canadian dollar. The financial statements of these foreign subsidiaries are remeasured into U.S. dollars using the historical exchange rate for property, plant, and equipment, timber and timberlands (related depreciation and amortization on both property, plant, and equipment and timber and timberlands), goodwill, and certain other non-monetary assets. We use the exchange rate at the balance sheet date for the remaining assets and liabilities, including deferred taxes. A weighted average exchange rate is used for each period for revenues and expenses. These transaction gains or losses are recorded in other non-operating income (expense) on the Consolidated Statements of Income.
The functional currencies of our Chilean, Brazilian, Colombian, Peruvian, Paraguayan, and Mexican subsidiaries are their respective local currencies. Assets and liabilities are translated into U.S. dollars using rates of exchange at the balance sheet date. Translation adjustments, which are based upon the exchange rate at the balance sheet date for assets and liabilities and the weighted average rate for the income statement, are recorded in accumulated comprehensive loss in stockholders’ equity on the Consolidated Balance Sheets. Our Argentine subsidiary operates under a highly inflationary economy and uses the Chilean Peso as the functional currency. Transaction gains and losses are recorded in other non-operating items on the Consolidated Statements of Income.
Advertising Costs
Other Operating Credits and Charges, Net
We classify amounts unrelated to ongoing core operating activities as other operating credits and charges, net in the Consolidated Statements of Income. Such items include, but are not limited to, restructuring charges (including severance charges), business exit credits and charges, charges to establish and maintain litigation or environmental reserves, product reserves, gains or losses from settlements with governmental or other organizations, and gains or losses on the sale or disposal of long-lived assets. Due to the nature of these items, amounts in the income statement can fluctuate from year to year. The determination of which items are considered significant and unrelated to core operations is based upon management’s judgment.
Retirement Benefits
57
Comprehensive Income
2. PRESENT AND PROSPECTIVE ACCOUNTING PRONOUNCEMENTS
Recently Adopted Accounting Pronouncements
Income Taxes (Topic 740): Improvements to Income Tax Disclosures
In December 2023, the Financial Accounting Standards Board (FASB) issued Accounting Standards Update (ASU) 2023-09, Income Taxes (Topic 740): Improvements to Income Tax Disclosures, which focuses on the rate reconciliation and income taxes paid. ASU 2023-09 requires a public business entity (PBE) to disclose, on an annual basis, a tabular rate reconciliation using both percentages and currency amounts, broken out into specified categories with certain reconciling items further broken out by nature and jurisdiction to the extent those items exceed a specified threshold. In addition, all entities are required to disclose income taxes paid, net of refunds received disaggregated by federal, state/local, and foreign and by jurisdiction if the amount is at least 5% of total income tax payments, net of refunds received. This pronouncement is effective for fiscal years beginning after December 15, 2024, with early adoption permitted. We have adopted ASU 2023-09 for the year ended December 31, 2025, on a prospective basis. See “Note 6 - Income Taxes” of the Notes to the Consolidated Financial Statements included in Item 8 of this annual report on Form 10-K.
Recent Pronouncements Not Yet Adopted
Income Statement (Subtopic 220-40): Disaggregation of Income Statement Expenses
In November 2024, the FASB issued ASU 2024-03, Income Statement—Reporting Comprehensive Income—Expense Disaggregation Disclosures (Subtopic 220-40), which requires entities to provide more detailed disaggregation of expenses in the income statement, focusing on the nature of the expenses rather than their function. ASU 2024-03 will require entities to separately present expenses for significant line items, including but not limited to, depreciation, amortization, and employee compensation. Entities will also be required to provide a qualitative description of the amounts remaining in relevant expense captions that are not separately disaggregated quantitatively, disclose the total amount of selling expenses and, in annual reporting periods, provide a definition of what constitutes selling expenses. This pronouncement is effective for fiscal years beginning after December 15, 2026, and interim periods within fiscal years beginning after December 15, 2027, with early adoption permitted. We are currently evaluating the impact of adopting this ASU on our consolidated financial statements and related disclosures.
Intangibles - Goodwill and Other-Internal-Use Software (Subtopic 350-40): Targeted Improvements to the Accounting for Internal-Use Software
In September 2025, the FASB issued ASU 2025-06, Intangibles-Goodwill and Other-Internal-Use Software (Subtopic 350-40): Targeted Improvements to the Accounting for Internal-Use Software, which modernizes the accounting for costs related to internal-use software by removing all references to project stages and clarifying the threshold entities apply to begin capitalizing costs. The guidance is effective for annual reporting periods beginning after December 15, 2027, and interim reporting periods within those annual reporting periods, and may be applied using a prospective, retrospective or modified transition approach. Early adoption is permitted as of the beginning of an annual reporting period. We are currently evaluating the impact of adopting this ASU on our consolidated financial statements and related disclosures.
3. REVENUE
We disaggregate revenue from contracts with customers into major product lines. We have determined that disaggregating revenue into these categories depicts how the nature, amount, timing, and uncertainty of revenue and cash flows are affected by economic factors.
58
The Company conducts business through three operating segments: Siding, OSB and LPSA. In the fourth quarter of 2025, the Company determined that LPSA did not meet the reportable segment criteria and beginning with the fourth quarter of 2025, the financial information for the LPSA operating segment is included in Other. These changes had no impact on our consolidated results of operations or financial position. Prior period segment information has been recast to conform to our current presentation. Our other operating segments, Siding and OSB remain reportable operating segments. Other now comprises our South American operations and other products that are not individually significant. See “Note 15 - Segment Information” of the Notes to the Consolidated Financial Statements included in Item 8 of this annual report on Form 10-K for further information regarding our reportable segments.
The following table presents revenues disaggregated by revenue source (dollar amounts in millions):
| Year Ended December 31, | |||||||||||||||||
| 2025 | 2024 | 2023 | |||||||||||||||
| Siding | $ | $ | $ | ||||||||||||||
| Other | |||||||||||||||||
| Net sales attributable to Siding | |||||||||||||||||
| OSB - Structural Solutions | |||||||||||||||||
| OSB - Commodity | |||||||||||||||||
| Other | |||||||||||||||||
| Net sales attributable to OSB | |||||||||||||||||
| Other | |||||||||||||||||
| Total Sales | $ | $ | $ | ||||||||||||||
During 2025, 2024, and 2023, our top ten customers accounted for approximately 47 %, 49 %, and 50 % of our sales, respectively, in the aggregate. No individual customer exceeded 10% of our sales in 2025, 2024, or 2023.
Our businesses routinely incur customer program costs to obtain favorable product placement, promote sales of products, and maintain competitive pricing. Customer program costs and incentives, including rebates and promotion and volume allowances, are accounted for as a reduction in net sales at the time the program is initiated and/or the revenue is recognized. The costs include, but are not limited to, volume allowances and rebates, promotional allowances, and cooperative advertising programs. These costs are recorded at the later of the time of sale or the implementation of the program based on management’s best estimates. Estimates are based on historical and projected experience for each type of program or customer. Volume allowances are accrued based on our estimates of customer volume achievement and other factors incorporated into customer agreements, such as new product purchases, store sell-through, merchandising support, and customer training. Management adjusts accruals when circumstances indicate (typically as a result of a change in volume expectations). As of December 31, 2025 and 2024, we accrued $50 million and $48 million, respectively, for customer rebates recorded in accounts payable and accrued liabilities on our Consolidated Balance Sheets.
We ship some of our products to customers’ distribution centers on a consignment basis. We retain title to our products stored at the distribution centers. As our products are removed from the distribution centers by retailers and shipped to retailers’ stores, title passes from us to the retailers. At that time, we invoice the retailers and recognize revenue for these consignment transactions. We do not offer a right of return for products shipped to the retailers’ stores from the distribution centers. The amount of consignment inventory as of December 31, 2025 and 2024, was $18 million and $23 million, respectively.
59
4. EARNINGS PER SHARE
Basic earnings per share is based on the weighted average number of shares of common stock outstanding. Diluted earnings per share is based upon the weighted average number of shares of common stock outstanding plus all potentially dilutive securities that were assumed to be converted into common shares at the beginning of the period under the treasury stock method. This method requires that the effect of potentially dilutive common stock equivalents (stock options, SSARs, restricted stock or units, and performance stock units) be excluded from the calculation of diluted earnings per share for the periods in which losses from continuing operations are reported because the effect is anti-dilutive.
The following table sets forth the computation of basic and diluted earnings per share (dollar and share amounts in millions):
Year Ended December 31, | |||||||||||||||||
2025 | 2024 | 2023 | |||||||||||||||
| Net income | $ | $ | $ | ||||||||||||||
| Weighted average common shares outstanding - basic | |||||||||||||||||
| Dilutive effect of employee stock plans | |||||||||||||||||
| Shares used for diluted earnings per share | |||||||||||||||||
| Net income per share of common stock: | |||||||||||||||||
Basic | $ | $ | $ | ||||||||||||||
Diluted | $ | $ | $ | ||||||||||||||
5. BUSINESS EXIT CREDITS AND CHARGES
During the second quarter of 2023, we ceased the manufacturing operations of Entekra, an off-site framing operation previously reported within Other, which comprises other products that are not individually significant. During 2024, the equity method investment held by Entekra sold substantially all of its net assets resulting in a $16 million distribution to LP and a gain of $11 million, which was recorded within equity in unconsolidated affiliate on the Consolidated Statements of Income. Business exit credits and charges, net consisted of the following (dollar amounts in millions):
Year Ended December 31, | |||||||||||||||||
| 2025 | 2024 | 2023 | |||||||||||||||
Impairment of property, plant and equipment, operating lease assets, and other intangible assets1 | $ | $ | $ | ( | |||||||||||||
Gain on sale of assets from an equity method investment2 | |||||||||||||||||
| Restructuring and other related charges: | |||||||||||||||||
Inventory write-down3 | ( | ||||||||||||||||
Other operating credits and charges including personnel-related costs such as severance4 | ( | ||||||||||||||||
Total business exit credits and charges | $ | $ | $ | ( | |||||||||||||
1 Included within loss on impairments on the Consolidated Statements of Income.
2 Included within equity in unconsolidated affiliates on the Consolidated Statements of Income.
3 Included within cost of sales on the Consolidated Statements of Income.
4 Included within other operating credits and charges, net on the Consolidated Statements of Income.
60
6. INCOME TAXES
Income Tax Provision
The components of income from continuing operations before income taxes, including equity in unconsolidated affiliates, were (dollar amounts in millions):
Year Ended December 31, | |||||||||||||||||
2025 | 2024 | 2023 | |||||||||||||||
| Domestic | $ | $ | $ | ||||||||||||||
| Foreign | |||||||||||||||||
| Total | $ | $ | $ | ||||||||||||||
The components of our income tax provision (benefit) from continuing operations were (dollar amounts in millions):
Year Ended December 31, | |||||||||||||||||
2025 | 2024 | 2023 | |||||||||||||||
| Current tax provision (benefit): | |||||||||||||||||
| U.S. federal | $ | $ | $ | ||||||||||||||
| State and local | ( | ( | |||||||||||||||
| Foreign | |||||||||||||||||
| Net current tax provision | |||||||||||||||||
| Deferred tax provision (benefit): | |||||||||||||||||
| U.S. federal | ( | ||||||||||||||||
| State and local | ( | ||||||||||||||||
| Foreign | ( | ||||||||||||||||
| Net valuation allowance increase (decrease) | |||||||||||||||||
| Net deferred tax provision (benefit) | ( | ||||||||||||||||
| Total income tax provision | $ | $ | $ | ||||||||||||||
61
Deferred Taxes
The tax effects of significant temporary differences creating deferred tax assets and liabilities were (dollar amounts in millions):
| December 31, | |||||||||||
2025 | 2024 | ||||||||||
| Deferred tax assets: | |||||||||||
| Accrued liabilities | $ | $ | |||||||||
| Benefit relating to capital loss, operating loss, and credit carryforwards | |||||||||||
| Inventories | |||||||||||
| Operating lease liabilities | |||||||||||
| Stock-based compensation | |||||||||||
| Currency remeasurement loss | |||||||||||
| Deferred revenue | |||||||||||
| Research expenditures | |||||||||||
| Other deferred tax assets | |||||||||||
| Total deferred tax assets | |||||||||||
| Valuation allowance | ( | ( | |||||||||
| Total deferred tax asset net of valuation allowance | $ | $ | |||||||||
| Deferred tax liabilities: | |||||||||||
| Property, plant and equipment | ( | ( | |||||||||
| Unremitted foreign earnings | ( | ( | |||||||||
| Operating lease assets | ( | ( | |||||||||
| Other deferred tax liabilities | ( | ( | |||||||||
| Total deferred tax liabilities | ( | ( | |||||||||
| Net deferred tax liabilities | $ | ( | $ | ( | |||||||
| Balance sheet classification: | |||||||||||
| Long-term deferred tax asset | $ | $ | |||||||||
| Long-term deferred tax liability | ( | ( | |||||||||
| Net deferred tax liabilities | $ | ( | $ | ( | |||||||
The benefit relating to capital loss, operating loss, and credit carryforwards included in the above table at December 31, 2025, consisted of (dollar amounts in millions):
| Operating Loss | Benefit Amount | Valuation Allowance | Expiration Beginning in | ||||||||||||||||||||
| Federal credit carryforwards | $ | — | $ | $ | No expiration | ||||||||||||||||||
| State credit carryforwards | — | ( | 2034 | ||||||||||||||||||||
| Canadian capital loss carryforwards | — | ( | No expiration | ||||||||||||||||||||
| Chile foreign tax credit carryforwards | — | No expiration | |||||||||||||||||||||
| Foreign operating loss carryforwards | ( | 2030 | |||||||||||||||||||||
| Total | $ | $ | $ | ( | |||||||||||||||||||
62
We periodically review the need for valuation allowances against deferred tax assets and recognize these deferred tax assets to the extent that their realization is more likely than not. As part of our review, we consider all positive and negative evidence, including earnings history, the future reversal of deferred tax liabilities, and the relevant expirations of carryforwards. We believe that the valuation allowances provided are appropriate. If future years’ earnings differ from the estimates used to establish these valuation allowances, or other objective positive or negative evidence arises, we may record an adjustment to the valuation allowance resulting in an impact on tax provision (benefit) for that period.
In 2023 we made the determination that a substantial portion of unremitted foreign earnings was no longer indefinitely reinvested and as of December 31, 2023, we recorded a deferred tax liability of $21 million related to the taxes expected to be imposed upon the repatriation of such foreign earnings to the United States. As of December 31, 2025, and 2024, the deferred tax liability related to unremitted foreign earnings was $25 million and $19 million, respectively.
In 2021, the Organization for Economic Cooperation and Development (OECD) announced an Inclusive Framework on Base Erosion and Profit Shifting, including the Pillar Two Model Rules (Pillar Two), applicable to large multinational corporations. These rules establish a global per-country minimum tax of 15%. Although, the United States has not enacted legislation to adopt the Pillar Two framework, and future adoption remains uncertain, certain countries where our operations are conducted have enacted such legislation.
Specifically, the Canadian and Brazilian governments enacted legislation in 2024 implementing certain aspects of the OECD’s minimum tax rules under the Pillar Two Framework. To date, no other jurisdictions in which LP operates have enacted Pillar Two legislation. At this time, Pillar Two legislation is not expected to have a material impact on the Company’s effective tax rate, consolidated results of operations, financial position, or cash flows. The Company will continue to monitor future developments related to Pillar Two legislation to assess any potential impact in the relevant jurisdictions.
On July 4, 2025, H.R. 1, a bill to provide for reconciliation pursuant to title II of H. Con. Res. 14, informally known as the One Big Beautiful Bill Act (“The Tax Act”), was enacted in the U.S., introducing a series of corporate tax changes in the U.S., including significant provisions such as the permanent extension of certain expiring provisions of the Tax Cuts and Jobs Act of 2017, modifications to the international tax framework, and the restoration of favorable tax treatment for certain business provisions. The legislation has multiple effective dates, with certain provisions effective in 2025 and others implemented thereafter through 2027. The provisions of The Tax Act effective in 2025 include 100% bonus depreciation on qualified property and full expensing for research and experimental expenditures. The impacts of The Tax Act are reflected in our results for the year ended December 31, 2025, and have no material impact on our income tax expense or effective tax rate. Certain provisions of The Tax Act decreased cash taxes paid during the year and may change the timing of cash tax payments in future periods.
63
Reconciliation of the U.S. Federal Statutory Rate to the Effective Rate
As further described in “Note 2 - Present and Prospective Accounting Pronouncements,” the Company has elected to prospectively adopt the guidance in ASU 2023-09, Income Taxes (Topic 740): Improvements to Income Taxes Disclosures. The following table is a reconciliation of the U.S. federal statutory tax rate to the total effective tax rates from continuing operations for the year ended December 31, 2025 in accordance with the guidance in ASU 2023-09 (dollar amounts in millions):
Year Ended December 31, | |||||||||||
| 2025 | |||||||||||
| Amount ($) | Percent (%) | ||||||||||
| U.S. federal statutory tax rate | $ | % | |||||||||
State and local income taxes1 | |||||||||||
Foreign tax effects | |||||||||||
| Chile | |||||||||||
| Unremitted foreign earnings | |||||||||||
| Inflationary adjustments | ( | ( | |||||||||
| Other | ( | ||||||||||
Canada | |||||||||||
Argentina | |||||||||||
| Changes in valuation allowances | |||||||||||
| Other | ( | ( | |||||||||
| Other foreign jurisdictions | |||||||||||
| U.S. Tax credits | |||||||||||
Research and development tax credits | ( | ( | |||||||||
| U.S. Nontaxable or nondeductible items | |||||||||||
Nondeductible compensation | |||||||||||
Changes in unrecognized tax benefits | ( | ( | |||||||||
Other adjustments | |||||||||||
| Provision for income taxes | $ | % | |||||||||
1State taxes in Arizona, California, Georgia, Indiana, Maine, Minnesota, North Carolina, and Pennsylvania made up the majority (greater than 50%) of the tax effect in this category.
64
The following table is a reconciliation of the U.S. federal statutory tax rate to the total effective tax rates from continuing operations for the years ended December 31, 2024 and 2023 in accordance with the guidance prior to the adoption of ASU 2023-09 (dollar amounts in millions):
Year Ended December 31, | |||||||||||||||||||||||
2024 | 2023 | ||||||||||||||||||||||
| Amount ($) | Percent (%) | Amount ($) | Percent (%) | ||||||||||||||||||||
| U.S. Federal tax rate | $ | % | $ | % | |||||||||||||||||||
| State and local income taxes | |||||||||||||||||||||||
| Effect of foreign tax rates | |||||||||||||||||||||||
| Uncertain tax positions | ( | ||||||||||||||||||||||
| Unremitted foreign earnings | |||||||||||||||||||||||
| Non deductible compensation | |||||||||||||||||||||||
| Tax credits | ( | ( | ( | ( | |||||||||||||||||||
| Prior year changes in tax laws and positions | ( | ( | |||||||||||||||||||||
| Revisions to prior year estimates | ( | ( | |||||||||||||||||||||
| Other items, net | ( | ( | |||||||||||||||||||||
| Provision for income taxes | $ | % | $ | % | |||||||||||||||||||
We are subject to U.S. federal income tax as well as income taxes of multiple state jurisdictions. Our foreign subsidiaries are subject to income tax in Canada, Chile, Brazil, Peru, Colombia, Argentina, Paraguay, and Mexico.
We generally remain subject to U.S. federal and state examinations for tax years 2018 and subsequent. In addition to the U.S., we have tax years that remain open and subject to examination by tax authorities in the following major tax jurisdictions: Brazil and Chile for tax years 2017 and subsequent; and Canada for tax years 2020 and subsequent. Our tax returns are currently under examination by tax authorities in the U.S. for years 2022 and 2023, Canada for year 2022, and in Chile for years 2016 and 2020.
Income Tax Payments
The following table is a summary of income taxes paid (net of refunds) by jurisdiction pursuant to the disclosure requirements of ASU 2023-09 for the year ended December 31, 2025 (dollar amounts in millions):
December 31, | |||||
2025 | |||||
Federal | $ | ||||
State | |||||
Foreign | |||||
| Canada | |||||
| Chile | |||||
| Brazil | |||||
| Other | |||||
Income Tax Payments | $ | ||||
We paid income taxes, net of refunds, of $42 million, $124 million, and $65 million during 2025, 2024, and 2023, respectively. Included in our Consolidated Balance Sheet at December 31, 2025 is a net income tax receivable of $11 million, compared to $1 million at December 31, 2024.
65
Uncertain Tax Positions
The following is a tabular reconciliation of the total amount of unrecognized tax benefits at the beginning and end of the years (dollar amounts in millions):
Year Ended December 31, | |||||||||||||||||
2025 | 2024 | 2023 | |||||||||||||||
| Beginning balance | $ | $ | $ | ||||||||||||||
| Increases: | |||||||||||||||||
| Tax positions taken in current year | |||||||||||||||||
| Tax positions taken in prior years | |||||||||||||||||
| Decreases: | |||||||||||||||||
| Settlements with taxing authorities in current year | ( | ||||||||||||||||
| Lapse of statute in current year | ( | ||||||||||||||||
| Ending balance | $ | $ | $ | ||||||||||||||
Included within other long-term liabilities on our Consolidated Balance Sheets at December 31, 2025, are $4 million of tax benefits that, if recognized, would affect our effective tax rate. We accrued and paid no
7. LEASES
Our lease portfolio consists primarily of real estate, mobile equipment at our manufacturing facilities, rail cars to transport our products, and a fleet of vehicles. We determine if an arrangement is a lease at contract inception. A lease exists when a contract conveys to the customer the right to control the use of identified property, plant, or equipment for a period of time in exchange for consideration.
As most of our leases do not provide an implicit rate, we used our incremental borrowing rate based on the information available at the commencement date in determining the present value of lease payments. The lease term for all our leases includes the non-cancellable period of the lease plus any additional periods covered by either an option to extend (or not to terminate) the lease that we are reasonably certain to exercise, or an option to extend (or not to terminate) the lease controlled by the lessor.
For each of the years ended December 31, 2025 and 2024, our weighted average discount rate was 4 %, and our weighted average remaining lease term was five years for operating leases.
Our operating leases are included in our Consolidated Balance Sheets and Consolidated Statements of Income as follows (dollar amounts in millions):
| December 31, | ||||||||||||||||||||
Balance Sheet Classification | 2025 | 2024 | ||||||||||||||||||
| Assets: | ||||||||||||||||||||
| Operating lease assets | Operating lease assets, net | $ | $ | |||||||||||||||||
| Total lease assets | $ | $ | ||||||||||||||||||
| Liabilities: | ||||||||||||||||||||
Current operating lease liability | Accounts payable and accrued liabilities | $ | $ | |||||||||||||||||
Non-current operating lease liability | Non-current operating lease liabilities | |||||||||||||||||||
| Total lease liabilities | $ | $ | ||||||||||||||||||
66
For the years ended December 31, 2025 and 2024, we incurred operating lease expenses of $9 million and $8 million, respectively, included within costs of sales and selling, general and administrative expenses. We made cash payments of $9 million and $7 million during the years ended December 31, 2025 and 2024, respectively, related to our operating leases. We further incurred operating lease expense of $2 million and $5 million related to short-term rent expense for the years ended December 31, 2025 and 2024, respectively.
We obtained right of use (ROU) assets in exchange for new operating lease liabilities of $5 million and $7 million for the years ended December 31, 2025 and 2024, respectively. We did not enter into any financing leases during 2025 or 2024.
The following table sets forth the minimum operating lease payments that are expected to be made in each of the years indicated (dollar amounts in millions):
| 2026 | $ | ||||
| 2027 | |||||
| 2028 | |||||
| 2029 | |||||
| 2030 | |||||
2031 and thereafter | |||||
Total operating lease payments | |||||
| Less: Interest | ( | ||||
Present value of operating lease liabilities | $ | ||||
8. LONG-TERM DEBT
December 31, 2025 | December 31, 2024 | ||||||||||||||||||||||||||||||||||||||||
(Dollar amounts in millions) | Interest Rate | Principal | Unamortized Debt Costs | Total | Principal | Unamortized Debt Costs | Total | ||||||||||||||||||||||||||||||||||
| Debentures: | |||||||||||||||||||||||||||||||||||||||||
| Senior unsecured notes, maturing 2029, interest rates fixed | $ | $ | ( | $ | $ | $ | ( | $ | |||||||||||||||||||||||||||||||||
| Amended Credit Facility, maturing 2028, interest rates variable | varies | ||||||||||||||||||||||||||||||||||||||||
| Total | $ | $ | ( | $ | $ | $ | ( | $ | |||||||||||||||||||||||||||||||||
| Less: current portion | |||||||||||||||||||||||||||||||||||||||||
| Long-term portion | $ | $ | ( | $ | $ | $ | ( | $ | |||||||||||||||||||||||||||||||||
67
Senior Notes
In March 2021, we issued $350 3.625 % Senior Notes due in 2029 (the 2029 Senior Notes). Since March 15, 2024, we have had the option, on one or more occasions, to redeem all or any portion of these notes at the redemption prices set forth in the indenture governing the 2029 Senior Notes, plus accrued and unpaid interest, if any, to, but not including, the date of redemption. The indenture governing the 2029 Senior Notes contains certain covenants that, among other things, limit our ability to grant liens to secure indebtedness, engage in sale and leaseback transactions, merge or consolidate or sell all or substantially all of our assets. If we are subject to a “change of control,” as defined in the indenture governing the 2029 Senior Notes, we are required to offer to repurchase the 2029 Senior Notes at a purchase price equal to 101 % of the principal amount thereof plus accrued and unpaid interest, if any, thereon up to, but not including, the date of purchase. The indenture governing the 2029 Senior Notes contains customary events of default, including failure to make required payments on the 2029 Senior Notes, failure to comply with certain agreements or covenants contained in the indenture governing the 2029 Senior Notes, failure to pay or acceleration of certain other indebtedness and certain events of bankruptcy and insolvency. An event of default in the indenture allows either the indenture trustee or the holders of at least 25 % in aggregate principal amount of the then-outstanding 2029 Senior Notes to accelerate, or in certain cases, automatically causes the acceleration of, the amounts due under the 2029 Senior Notes.
Deferred debt costs are amortized over the life of the related debt using a straight-line basis which approximates the effective interest method. If the debt is retired early, the related unamortized deferred financing costs are written off in the period the debt is retired to other non-operating income (expense).
Credit Facilities
In November 2022, LP entered into a Second Amended and Restated Credit Agreement with American AgCredit, PCA, as administrative agent and sole lead arranger, CoBank, ACB, as letter of credit issuer, and certain other lender parties (the Credit Agreement), relating to its revolving credit facility. On March 26, 2025, LP entered into the First Amendment to Second Amended and Restated Credit Agreement (the First Amendment) with American AgCredit, PCA, as administrative agent, CoBank, ACB, as letter of credit issuer, and the lenders and voting participants party thereto, which amended the Credit Agreement (the Amended Credit Agreement) to (1) increase the aggregate principal amount for the credit facility (the Amended Credit Facility) from $550 million to $750 million, (2) increase the sub-limit for letters of credit from $60 million to $75 million, (3) change the interest rate for revolving borrowing, (4) change the capitalization ratio limit, and (5) extend the maturity date to March 26, 2032.
There were no outstanding borrowings pursuant to the Amended Credit Facility as of December 31, 2025. Revolving borrowings under the Amended Credit Facility accrue interest, at our option, at either (a) a “base rate” plus a margin of 0.500 % to 1.500 % or (b) Adjusted Term SOFR (i.e., Term SOFR Rate plus an adjustment of 0.10 %) plus a margin of 1.500 % to 2.500 %. The Amended Credit Facility also includes an unused commitment fee, due quarterly, ranging from 0.200 % to 0.425 %. The applicable margins and fees within these ranges are based on our ratio of consolidated earnings before interest, taxes, depreciation and amortization (EBITDA) to cash interest charges. The “base rate” is the highest of (i) the federal funds rate plus 0.5 %, (ii) the U.S. prime rate, and (iii) one-month Adjusted Term SOFR plus 1.0 %.
The Amended Credit Agreement contains various restrictive covenants and customary events of default, the occurrence of which could result in the acceleration of our obligation to repay the indebtedness outstanding thereunder. The Amended Credit Agreement also contains financial covenants that, among other things, require us and our consolidated subsidiaries to have, as of the end of each fiscal quarter, a capitalization ratio (i.e., funded debt less unrestricted cash to total capitalization) of no more than 65 %.
In May 2024, LP entered into a new letter of credit facility agreement (the LOC Facility Agreement), replacing the letter of credit facility agreement dated May 2020. The LOC Facility Agreement provides for the funding of letters of credit up to an aggregate outstanding amount of $20 million, which may be secured by certain cash collateral of LP (the Letter of Credit Facility). The LOC Facility Agreement provides for a letter of credit fee, due quarterly, ranging from 1.000 % to 1.875 % of the daily available amount to be drawn on each letter of credit issued under the Letter of Credit Facility. The LOC Facility Agreement contains similar affirmative, negative, and financial covenants as those set forth in the Amended Credit Agreement, including the capitalization ratio covenant. All amounts outstanding under the Letter of Credit Facility become due on April 15, 2029.
68
As of December 31, 2025, we were in compliance with all financial covenants under the 2029 Senior Notes, the Amended Credit Agreement and the LOC Facility Agreement.
Deferred debt costs are amortized over the life of the related debt using a straight-line basis, which approximates the effective interest method. Included in such amortized amounts are deferred debt costs associated with our Amended Credit Facility of $4 million, which are recorded within other assets on our Consolidated Balance Sheets. We amortized deferred debt costs of $1 million for each of the years ended December 31, 2025, 2024, and 2023.
The weighted average interest rate for all long-term debt at December 31, 2025 and 2024 was approximately 3.6 %. Required repayment of principal for long-term debt is as follows (dollar amounts in millions):
| Years ending December 31, | |||||
| 2026 | $ | ||||
| 2027 | |||||
| 2028 | |||||
| 2029 | |||||
2031 and thereafter | |||||
| Total | $ | ||||
We estimated the 2029 Senior Notes to have a fair value of $341 million and $323 million at December 31, 2025 and 2024, respectively, based upon market quotations. Fair values were based on trading activity among the Company’s lenders and the average bid and ask price as determined using published rates (Level 1 in the U.S. GAAP fair value hierarchy).
9. STOCKHOLDERS’ EQUITY
Preferred Stock
We are authorized to issue up to 15,000,000 shares of preferred stock at $1.00 par value. At December 31, 2025, no shares of preferred stock have been issued.
Stock Award Plan
We have a stock-based compensation plan under which stock options, SSARs, restricted stock, restricted stock units, and performance stock units may be granted. At December 31, 2025, approximately four million shares were available under the current plan for these awards.
Year Ended December 31, | |||||||||||||||||
| (Dollar amounts in millions) | 2025 | 2024 | 2023 | ||||||||||||||
| Total stock-based compensation expense (cost of sales and selling, general and administrative) | $ | $ | $ | ||||||||||||||
| Income tax benefit related to stock-based compensation | $ | $ | $ | ||||||||||||||
| Impact on cash flow due to taxes paid related to net share settlement of equity awards | $ | ( | $ | ( | $ | ( | |||||||||||
We recognize the compensation costs on a straight-line basis over the requisite service period of the award, which is generally the vesting term of three years .
SSARs
Prior to January 1, 2018, we granted SSARs to key employees under the Company’s then-current stock award plan. Upon exercise of the SSARs, we generally issue the underlying shares from treasury. The SSARs were granted at market price at the date of grant. The SSARs became exercisable over three years and expire ten years after the date of grant. All outstanding SSARs were vested as of December 31, 2025.
69
Restricted Stock Units and Performance Stock Units
We grant time-vested restricted stock units (RSUs) and performance stock units (PSUs) to certain key employees and time-vested RSUs to non-employee directors under our stock award plan. RSUs generally vest (i) ratably over a three-year vesting period for employees and (ii) in full on the first anniversary of the grant date for non-employee directors. Certain of these awards are eligible to receive dividend equivalent shares. The grant date fair value of these awards approximates market value of the shares. PSUs generally vest based upon the attainment of certain performance and market metrics over a three-year cumulative performance period. Awards based upon the achievement of the performance goals are earned ratably from 0 % to 200 %. If the threshold performance level for the relevant performance goal is met at the end of the performance period, the award may be adjusted based on LP’s three-year total shareholder return (TSR) performance relative to a capital market peer group. This TSR modifier can increase or decrease the award by 20 %, although the TSR modifier cannot cause the award to exceed the maximum of 200 %.
Summary of Stock Awards Outstanding
The following table summarizes stock awards as of December 31, 2025, as well as activity during the last year:
| Stock Options / SSARS | Restricted Stock Units and Performance Stock Units | ||||||||||||||||||||||
| Number of Awards | Weighted Average Exercise Price | Number of Awards | Weighted Average Grant Date Fair Value | ||||||||||||||||||||
Outstanding at December 31, 2024 | $ | $ | |||||||||||||||||||||
| Granted | |||||||||||||||||||||||
| Exercised | ( | ( | |||||||||||||||||||||
| Forfeited/cancelled | ( | ||||||||||||||||||||||
Outstanding at December 31, 2025 | $ | $ | |||||||||||||||||||||
Vested and expected to vest at December 31, 20251 | $ | ||||||||||||||||||||||
Exercisable at December 31, 2025 | $ | ||||||||||||||||||||||
| Unrecognized compensation costs (in millions) | $ | $ | |||||||||||||||||||||
| To be recognized over weighted-average period of years | |||||||||||||||||||||||
1Expected to vest based upon historical forfeiture rate.
In July 2025, LP modified the performance vesting criteria of approximately 101,000 outstanding PSU awards that were granted in 2023. The modification relating to the 2023 PSU awards was considered a Type III modification under Accounting for Share-Based Payments (FASB ASC Topic 718) because it changed the expectation from improbable to probable that the awards would ultimately vest, in which the original awards were cancelled, and the modified awards were considered granted on the modification date. Stock-based compensation expense related to these modified awards will be recognized over the remaining vesting period based on the expected number of awards to vest using fair values per share of $92.30 . Stock-based compensation expense related to the 2023 PSU modification was $7 million for the year ended December 31, 2025.
The aggregate intrinsic value of the stock options and SSARs is the total pre-tax intrinsic value (the difference between our closing stock price on the last trading day of a fiscal year and the exercise price, multiplied by the number of in-the-money options and SSARs) that would have been received by the holders had all holders exercised their awards on the last day of such fiscal year. This amount changes based on the market value of our stock, as reported by the New York Stock Exchange. The intrinsic value of SSARs and stock options exercised in the years ended December 31, 2025, 2024, and 2023 was $0 million, $13 million, and $3 million, respectively.
The total fair value of awards vested during the years ended December 31, 2025, 2024, and 2023, was $17 million, $19 million, and $31 million, respectively.
70
Share Repurchases
On May 7, 2024, LP’s Board of Directors authorized the 2024 Share Repurchase Program under which we may repurchase shares of LP common stock totaling up to $250 million.
During 2025, we paid $61 million to repurchase approximately 1 million shares of our common stock through market purchases at an average price of $108.55 per share. During 2024, we paid $212 million to repurchase approximately 2 million shares of our common stock through market purchases at an average price of $87.98 per share.
We had an aggregate of $177 million of repurchase authorization remaining under the 2024 Share Repurchase Program as of December 31, 2025.
Employee Stock Purchase Plan
10. OTHER OPERATING AND NON-OPERATING INCOME (EXPENSE)
Other operating credits and charges, net
The major components of other operating credits and charges, net in the Consolidated Statements of Income for the years ended December 31, 2025, 2024, and 2023 are reflected in the table below and described in the paragraphs following the table (dollar amounts in millions):
Year Ended December 31, | |||||||||||||||||
2025 | 2024 | 2023 | |||||||||||||||
| Legal settlement | ( | ||||||||||||||||
| Reorganization charges | ( | ( | ( | ||||||||||||||
| Product-line discontinuance charges | ( | ||||||||||||||||
| Gain (loss) on asset sales | ( | ||||||||||||||||
| Other | ( | ( | |||||||||||||||
Other operating credits and charges, net | $ | ( | $ | ( | $ | ( | |||||||||||
During 2025, we paid $6 million related to certain reorganizations, including severances, and recognized $2 million of product-line discontinuance charges related to inventory we are no longer planning to sell.
During 2024, we received $3 million related to legal settlements, incurred severance and other charges of $2 million related to certain reorganizations, and recognized a $2 million loss on the sales of assets.
During 2023, we agreed to pay $16 million to resolve certain patent-related claims and to obtain certain patent rights. We incurred severance and other charges of $8 million related to certain reorganizations and recognized a $6 million gain on the sale of assets.
71
Non-operating income (expense)
Non-operating income (expense) is comprised of the following components (dollar amounts in millions):
Year Ended December 31, | |||||||||||||||||
2025 | 2024 | 2023 | |||||||||||||||
| Interest expense | $ | ( | $ | ( | $ | ( | |||||||||||
| Amortization of debt charges | ( | ( | ( | ||||||||||||||
| Capitalized interest | |||||||||||||||||
| Interest expense, net of capitalized interest | $ | ( | $ | ( | $ | ( | |||||||||||
| Interest income | $ | $ | $ | ||||||||||||||
| Investment income | $ | $ | $ | ||||||||||||||
| Foreign currency gain (loss), net | $ | ( | $ | $ | ( | ||||||||||||
| Pension settlement charges | ( | ||||||||||||||||
| Other | |||||||||||||||||
Other non-operating (expense) income | $ | ( | $ | $ | ( | ||||||||||||
During 2025, we recognized $15 million of foreign currency losses primarily driven by $2 million and $13 million of transactional gains on Canadian and South American exchange rates, respectively.
During 2024, we recognized $9 million of foreign currency gains primarily driven by $4 million and $5 million of transactional gains on Canadian and South American exchange rates, respectively.
During 2023, we completed the termination of our U.S. and Canadian defined benefit pension plans resulting in the recognition of non-cash, pre-tax charges of $4 million. Additionally, we recognized $40 million of foreign currency losses primarily driven by $32 million of transactional losses on the Argentine peso.
11. IMPAIRMENT OF LONG-LIVED ASSETS
We review the carrying values of our long-lived assets for potential impairments and believe we have adequate support for the carrying value of each of these assets based upon the anticipated cash flows that result from our estimates of future demand, pricing, and production costs, assuming certain levels of planned capital expenditures. However, if demand and pricing for our products fall to levels significantly below cycle average demand and pricing, should we decide to invest capital in alternative projects, or should changes occur related to our wood supply for our mills, it is possible that future impairment charges will be required.
We also review from time to time possible dispositions of various assets in light of current and anticipated economic and industry conditions, our strategic plan, and other relevant factors. Because a determination to dispose of particular assets can require management to make assumptions regarding the transaction structure of the disposition and to estimate the net sales proceeds, which may be less than previous estimates of undiscounted future net cash flows, we may be required to record impairment charges in connection with decisions to dispose of assets.
72
12. COMMITMENTS AND CONTINGENCIES
We maintain reserves for various contingent liabilities as follows (dollar amounts in millions):
| December 31, | |||||||||||
2025 | 2024 | ||||||||||
| Environmental reserves | $ | $ | |||||||||
| Other reserves | |||||||||||
| Total contingencies | $ | $ | |||||||||
Current portion1 | ( | ( | |||||||||
| Long-term portion | $ | $ | |||||||||
1Included within accounts payable and accrued liabilities on the Consolidated Balance Sheets.
Estimates of our loss contingencies are based on various assumptions and judgments. Due to the numerous uncertainties and variables associated with these assumptions and judgments, both the precision and reliability of the resulting estimates of the related contingencies are subject to substantial uncertainties. We regularly monitor our estimated exposure to contingencies and, as additional information becomes known, may change our estimates significantly. While no estimate of the range of any such change can be made at this time, the amount that we may ultimately pay in connection with these matters could materially exceed, in either the near term or the longer term, the amounts accrued to date. Our estimates of our loss contingencies do not reflect potential future recoveries from insurance carriers except to the extent that recovery may, from time to time, be deemed probable as a result of an insurer’s agreement to payment terms.
Environmental Matters
We maintain a reserve for undiscounted estimated environmental loss contingencies. This reserve is primarily for estimated future costs of remediation of hazardous or toxic substances at numerous sites currently or previously owned by the Company. Our estimates of our environmental loss contingencies are based on various assumptions and judgments, the specific nature of which varies considering the particular facts and circumstances surrounding each environmental loss contingency. These estimates typically reflect assumptions and judgments as to the probable nature, magnitude, and timing of the required investigation, remediation and/or monitoring activities and the probable cost of these activities, and in some cases reflect assumptions and judgments as to the obligation or willingness and ability of third parties to bear a proportionate or allocated share of the cost of these activities. Due to the numerous uncertainties and variables associated with these assumptions and judgments, and the effects of changes in governmental regulation and environmental technologies, both the precision and reliability of the resulting estimates of the related contingencies are subject to substantial uncertainties. We regularly monitor our estimated exposure to environmental loss contingencies and, as additional information becomes known, may change our estimates significantly.
The activity in our reserve for estimated environmental loss contingency reserves is summarized in the following table (dollar amounts in millions):
Year Ended December 31, | |||||||||||
2025 | 2024 | ||||||||||
| Beginning balance | $ | $ | |||||||||
| Adjustments to expense (other operating credits and charges, net and cost of sales) | |||||||||||
| Payments made | ( | ( | |||||||||
| Ending balance | $ | $ | |||||||||
During 2024, we adjusted our reserves at several sites to reflect current estimates of remediation costs and environmental settlements.
73
Other Proceedings
We are party to other legal proceedings in the ordinary course of business. Based on the information currently available, we do not believe that the resolution of such proceedings could reasonably be expected to have a material adverse effect on our financial position, results of operations, cash flows, or liquidity.
Self-Insurance
We are primarily self-insured for workers’ compensation and employee health care liability costs. Self-insurance liabilities for workers’ compensation are determined based upon a valuation performed by an actuarial firm. The estimate of future workers’ compensation liabilities incorporates loss development and an estimate associated with incurred but not yet reported claims. These claims are discounted. Self-insurance liabilities for employee health costs are determined actuarially based upon claims filed and estimated claims incurred but not yet reported. These claims are discounted.
Indemnities and Guarantees
We are a party to certain contracts in which we agree to indemnify third parties for certain liabilities that arise out of or relate to the subject matter of the contract. In some cases, this indemnity extends to related liabilities arising out of the negligence of the indemnified parties, but usually excludes any liabilities caused by gross negligence or willful misconduct of the indemnified parties. We cannot estimate the potential amount of future payments under these agreements until events arise that would trigger the liability.
Additionally, in connection with certain sales of assets and divestitures of businesses, we have agreed to indemnify the applicable buyer and certain related parties for certain losses or liabilities incurred by the buyer or such related parties with respect to (1) the representations and warranties made to the buyer by us in connection with the applicable sale or divestiture and (2) liabilities related to the pre-closing operations of the assets or businesses sold. Indemnities related to pre-closing operations generally include environmental liabilities, tax liabilities, and other liabilities not assumed by the buyer.
Indemnities related to the pre-closing operations of sold assets or divested businesses typically do not represent added liabilities for us, but simply serve to protect the buyer from potential liability associated with the obligations that existed (known and unknown) at the time of the sale. We record accruals for those pre-closing obligations that are considered probable and estimable. We have not accrued any additional amounts as a result of the indemnity agreements summarized below, as we believe the fair value of the guarantees is not material.
In connection with various sales of our timberlands, we have agreed to indemnify the relevant buyers with respect to losses resulting from breaches of limited representations and warranties contained in the related agreements. These indemnities generally are capped at a maximum potential liability and have an unspecified duration.
We also have various other indemnities that are individually and in the aggregate immaterial.
We record a liability related to specific indemnification when future payment is probable, and the amount is estimable.
74
13. PRODUCT WARRANTIES
We offer warranties on the sale of most of our products and record an accrual for estimated future claims. Such accruals are based upon historical experience and management’s estimate of the level of future claims. The activity in warranty reserves is summarized in the following table (dollar amounts in millions):
Year Ended December 31, | |||||||||||
2025 | 2024 | ||||||||||
| Beginning balance | $ | $ | |||||||||
| Changes in warranty provision | |||||||||||
| Payments made | ( | ( | |||||||||
| Total warranty reserves | $ | $ | |||||||||
Current portion of warranty reserves1 | ( | ( | |||||||||
Long-term portion of warranty reserves2 | $ | $ | |||||||||
1Included within accounts payable and accrued liabilities on the Consolidated Balance Sheets.
2Included within other long-term liabilities on the Consolidated Balance Sheets.
We believe that the warranty reserve balances at December 31, 2025 are adequate to cover future warranty payments. However, it is possible that additional charges may be required.
14. RETIREMENT PLANS AND POST-RETIREMENT BENEFITS
We sponsor various defined contribution retirement plans and benefit pension plans that provide retirement benefits to substantially all our employees. Most regularly scheduled employees are eligible to participate in the defined contribution retirement plans except those covered by a collective bargaining agreement unless the collective bargaining agreement explicitly allows for participation in our plans. We contribute to a multiemployer plan for certain employees covered by collective bargaining agreements. We also provide other post-retirement benefits consisting primarily of healthcare benefits to certain retirees who meet age and service requirements. The defined benefit pension plans were limited to active and retired employees that were eligible prior to the plans being frozen.
Defined Contribution Plans
We sponsor defined contribution plans in the U.S. and Canada. In the U.S., these plans are primarily 401(k) plans for hourly and salaried employees that allow for pre-tax employee deferrals and a Company match of up to 5 % of an employee’s eligible wages (subject to certain limits). Under the profit-sharing feature of these plans, we may elect to contribute a discretionary amount as a percentage of eligible wages. Included in the assets of the 401(k) and profit-sharing plans are 0.4 million shares of LP common stock that represented approximately 6 % of the total market value of plan assets at December 31, 2025.
In Canada, we sponsor both defined contribution plans and Registered Retirement Savings Plans for hourly and salaried employees that allow for employee tax deferrals. We provide a 100 % match for employee contributions up to 4 % and provide a 50 % match of employee’s contributions from 4 % to 6 % (subject to certain limits).
Expenses related to the U.S. and Canadian defined contribution plans and the Registered Retirement Savings Plans, including the profit-sharing feature, were $21 million, $20 million, and $15 million in 2025, 2024, and 2023, respectively.
Other Benefit Plans
We have several plans that provide post-retirement benefits other than pensions, primarily for salaried employees in the U.S. and certain groups of Canadian employees. The obligation at December 31, 2025 and 2024 for these post-retirement benefits was $7 million and $8 million, respectively. The net expense related to these plans was not significant in 2025, 2024, or 2023.
75
In 2004, we adopted the Louisiana-Pacific Corporation 2004 Executive Deferred Compensation Plan (the Deferred Compensation Plan). Pursuant to the Deferred Compensation Plan, participants are eligible to defer up to 90 % of their base salary and annual cash incentives that exceed the limitation as set forth by the Internal Revenue Service and receive a 5 % match on their contributions. Each Deferred Compensation Plan participant is fully vested in all employee deferred compensation and earnings credited associated with employee contributions. Employer contributions and associated earnings vest over periods not exceeding five years . The liability under the Deferred Compensation Plan amounted to $3 million as of December 31, 2025, and 2024, and is included in other long-term liabilities on our Consolidated Balance Sheets.
15. SEGMENT INFORMATION
The Company defines its operating segments as those operations that engage in business activities from which revenues are earned and expenses incurred, for which discrete financial information is available, and that are regularly reviewed to analyze performance and allocate resources by the chief operating decision maker (“CODM”), the Company’s Chief Executive Officer.
Change in Reportable Segments
The Company conducts business through three operating segments: Siding, OSB and LP South America (LPSA). In the fourth quarter of 2025, the Company determined that LPSA did not meet the reportable segment criteria and beginning with the fourth quarter of 2025, the financial information for the LPSA operating segment is included in Other. These changes had no impact on our consolidated results of operations or financial position. Prior period segment information has been recast to conform to our current presentation. Our other operating segments, Siding and OSB remain reportable operating segments. Other now comprises our South American operations and other products that are not individually significant.
•The Siding segment serves diverse end markets with a broad product portfolio of engineered wood siding, trim, soffit, and fascia. Our Siding is offered primed (LP® SmartSide® Trim & Siding, LP BuilderSeries® Lap Siding, and LP® Outdoor Building Solutions®) and pre-finished (LP® SmartSide® ExpertFinish® Trim & Siding) to meet the needs of builders and installers in new construction and repair and remodeling applications.
•The OSB segment manufactures and distributes OSB structural panel products, including the innovative value-added OSB product portfolio known as LP® Structural Solutions (which includes LP® FlameBlock® Fire-Rated Sheathing, LP WeatherLogic® Air & Water Barrier, LP® TechShield® Radiant Barrier, LP Legacy® Premium Sub-Flooring, and LP® TopNotch® 350 Durable Sub-Flooring).
The accounting policies of the segments are the same as those described in the Company’s summary of significant accounting policies. We evaluate the performance of our operating segments based on segment Adjusted EBITDA, which the CODM uses to evaluate performance and allocate resources.
Segment Adjusted EBITDA is defined as net income before interest expense, provision for income taxes, depreciation and amortization, and excludes stock-based compensation expense, loss on impairment, business exit credit and charges, product-line discontinuance charges, other operating credits and charges, net, loss on early debt extinguishment, investment income, pension settlement charges, and other non-operating income (expense).
The CODM uses segment Adjusted EBITDA predominantly in the annual budget and forecasting process. The CODM considers budget-to-actual variances on a quarterly basis when making decisions about the allocation of operating and capital resources to each segment. The CODM also uses segment Adjusted EBITDA to assess the relative performance of each segment and to determine the compensation of certain employees.
76
Information about our segments is as follows (dollar amounts in millions):
Year Ended December 31, 2025 | |||||||||||||||||
| Siding | OSB | Total | |||||||||||||||
| Revenues from external customers | $ | $ | $ | ||||||||||||||
| Reconciliation of revenue | |||||||||||||||||
Other revenues1 | |||||||||||||||||
| Total consolidated revenues | $ | ||||||||||||||||
| Less: | |||||||||||||||||
| Cost of sales | ( | ( | |||||||||||||||
| Selling, general, and administrative expenses | ( | ( | |||||||||||||||
| Depreciation and amortization | |||||||||||||||||
Other segment items2 | |||||||||||||||||
Reportable segment Adjusted EBITDA | $ | $ | $ | ||||||||||||||
Year Ended December 31, 2024 | |||||||||||||||||
| Siding | OSB | Total | |||||||||||||||
| Revenues from external customers | $ | $ | $ | ||||||||||||||
| Reconciliation of revenue | |||||||||||||||||
Other revenues1 | |||||||||||||||||
| Total consolidated revenues | $ | ||||||||||||||||
| Less: | |||||||||||||||||
| Cost of sales | ( | ( | |||||||||||||||
| Selling, general, and administrative expenses | ( | ( | |||||||||||||||
| Depreciation and amortization | |||||||||||||||||
Other segment items2 | |||||||||||||||||
Reportable segment Adjusted EBITDA | $ | $ | $ | ||||||||||||||
Year Ended December 31, 2023 | |||||||||||||||||
| Siding | OSB | Total | |||||||||||||||
| Revenues from external customers | $ | $ | $ | ||||||||||||||
| Reconciliation of revenue | |||||||||||||||||
Other revenues1 | |||||||||||||||||
| Total consolidated revenues | $ | ||||||||||||||||
| Less: | |||||||||||||||||
| Cost of sales | ( | ( | |||||||||||||||
| Selling, general, and administrative expenses | ( | ( | |||||||||||||||
| Depreciation and amortization | |||||||||||||||||
Other segment items2 | |||||||||||||||||
Reportable segment Adjusted EBITDA | $ | $ | $ | ||||||||||||||
1Other revenues include sales from LPSA and other minor products, services, and closed operations that do not meet the criteria for discontinued operations.
2Other segment items include stock compensation expense.
77
Year Ended December 31, | |||||||||||||||||
2025 | 2024 | 2023 | |||||||||||||||
| Reconciliation of profit (loss) | |||||||||||||||||
Reportable Segment adjusted EBITDA | $ | $ | $ | ||||||||||||||
| Add (deduct): | |||||||||||||||||
Other Adjusted EBITDA1 | ( | ( | |||||||||||||||
| Equity in unconsolidated affiliate | ( | ( | ( | ||||||||||||||
| Depreciation and amortization | ( | ( | ( | ||||||||||||||
| Stock-based compensation expense | ( | ( | ( | ||||||||||||||
Loss on impairment1 | ( | ( | ( | ||||||||||||||
Other operating credits and charges, net2,3 | ( | ( | ( | ||||||||||||||
Product-line discontinuance charges3 | ( | ||||||||||||||||
Business exit credits and charges2 | ( | ||||||||||||||||
| Interest expense | ( | ( | ( | ||||||||||||||
| Investment income | |||||||||||||||||
Other non-operating (expense) income | ( | ( | |||||||||||||||
| Income before income taxes | $ | $ | $ | ||||||||||||||
1Other Adjusted EBITDA includes LPSA, corporate, and other minor products, services, and closed operations that do not meet the criteria for discontinued operations.
2See further discussion in “Note 5 - Business Exit Credits and Charges” of the Notes to the Consolidated Financial Statements.
3See further discussion in “Note 10 - Other Operating and Non-Operating Income (Expense)” of the Notes to the Consolidated Financial Statements.
Year Ended December 31, | |||||||||||||||||
2025 | 2024 | 2023 | |||||||||||||||
| Capital Expenditures | |||||||||||||||||
| Siding | $ | $ | $ | ||||||||||||||
| OSB | |||||||||||||||||
| Other | |||||||||||||||||
| Total capital expenditures | $ | $ | $ | ||||||||||||||
| December 31, | |||||||||||
2025 | 2024 | ||||||||||
| Identifiable Assets | |||||||||||
| Siding | $ | $ | |||||||||
| OSB | |||||||||||
| Other | |||||||||||
| Total assets | $ | $ | |||||||||
Other identifiable assets include cash and cash equivalents, short-term and long-term investments, corporate assets, and other items.
78
Changes in goodwill by segment for the years ended December 31, 2025 and 2024, are provided in the following table (dollar amounts in millions):
| Siding | OSB | Total | |||||||||||||||
Balance at December 31, 2023 | $ | $ | $ | ||||||||||||||
| Impairment charges | |||||||||||||||||
Balance at December 31, 2024 | |||||||||||||||||
| Impairment charges | |||||||||||||||||
Balance at December 31, 2025 | $ | $ | $ | ||||||||||||||
Information concerning our geographic areas is as follows (dollar amounts in millions):
Year Ended December 31, | |||||||||||||||||
2025 | 2024 | 2023 | |||||||||||||||
Total sales - Point of origin | |||||||||||||||||
| U.S. | $ | $ | $ | ||||||||||||||
| Canada | |||||||||||||||||
| South America | |||||||||||||||||
Inter-geographic sales | ( | ( | ( | ||||||||||||||
Total sales | $ | $ | $ | ||||||||||||||
Year Ended December 31, | |||||||||||
2025 | 2024 | ||||||||||
Long lived assets | |||||||||||
| U.S. | $ | $ | |||||||||
| Canada | |||||||||||
| South America | |||||||||||
Total long lived assets | $ | $ | |||||||||
Long lived assets include property, plant and equipment, timber and timberlands, and right of use assets.
79
ITEM 9. Changes in and Disagreements with Accountants on Accounting and Financial Disclosure
None.
ITEM 9A. Controls and Procedures
Evaluation of Disclosure Controls and Procedures
As of December 31, 2025, our Chief Executive Officer and Chief Financial Officer carried out, with the participation of the Company’s management, a review and evaluation of the effectiveness of our disclosure controls and procedures, as defined in Rule 13a-15(e) promulgated under the Exchange Act. Based upon this evaluation, the Chief Executive Officer and Chief Financial Officer have concluded that, as of December 31, 2025, our disclosure controls and procedures were effective.
Changes in Internal Control over Financial Reporting
There were no changes in our internal control over financial reporting that occurred during our most recently completed fiscal quarter that have materially affected, or are reasonably likely to materially affect, our internal control over financial reporting.
Management’s Report on Internal Control Over Financial Reporting
Our management is responsible for establishing and maintaining adequate internal control over financial reporting, as defined in Rule 13a-15(f) promulgated under the Exchange Act. Our management conducted an assessment of the effectiveness of our internal control over financial reporting as of the end of the period covered by this report, based on the framework established by the Committee of Sponsoring Organizations of the Treadway Commission in Internal Control-Integrated Framework (2013). Based on this assessment, our management has concluded that, as of December 31, 2025, the Company’s internal control over financial reporting was effective. Our independent registered public accounting firm, Deloitte & Touche LLP, has audited our internal control over financial reporting as of the end of the period covered by this report, as stated in their report included herein.
80
REPORT OF INDEPENDENT REGISTERED PUBLIC ACCOUNTING FIRM
To the stockholders and the Board of Directors of Louisiana-Pacific Corporation
Opinion on Internal Control over Financial Reporting
We have audited the internal control over financial reporting of Louisiana-Pacific Corporation and subsidiaries (the “Company”) as of December 31, 2025, based on criteria established in Internal Control— Integrated Framework (2013) issued by the Committee of Sponsoring Organizations of the Treadway Commission (COSO). In our opinion, the Company maintained, in all material respects, effective internal control over financial reporting as of December 31, 2025, based on criteria established in Internal Control— Integrated Framework (2013) issued by COSO.
We have also audited, in accordance with the standards of the Public Company Accounting Oversight Board (United States) (PCAOB), the consolidated financial statements as of and for the year ended December 31, 2025, of the Company and our report dated February 17, 2026, expressed an unqualified opinion on those financial statements.
Basis for Opinion
The Company’s management is responsible for maintaining effective internal control over financial reporting and for its assessment of the effectiveness of internal control over financial reporting, included in the accompanying Management’s Report on Internal Control over Financial Reporting. Our responsibility is to express an opinion on the Company’s internal control over financial reporting based on our audit. We are a public accounting firm registered with the PCAOB and are required to be independent with respect to the Company in accordance with the U.S. federal securities laws and the applicable rules and regulations of the Securities and Exchange Commission and the PCAOB.
We conducted our audit in accordance with the standards of the PCAOB. Those standards require that we plan and perform the audit to obtain reasonable assurance about whether effective internal control over financial reporting was maintained in all material respects. Our audit included obtaining an understanding of internal control over financial reporting, assessing the risk that a material weakness exists, testing and evaluating the design and operating effectiveness of internal control based on the assessed risk, and performing such other procedures as we considered necessary in the circumstances. We believe that our audit provides a reasonable basis for our opinion.
Definition and Limitations of Internal Control over Financial Reporting
A company’s internal control over financial reporting is a process designed to provide reasonable assurance regarding the reliability of financial reporting and the preparation of financial statements for external purposes in accordance with generally accepted accounting principles. A company’s internal control over financial reporting includes those policies and procedures that (1) pertain to the maintenance of records that, in reasonable detail, accurately and fairly reflect the transactions and dispositions of the assets of the company; (2) provide reasonable assurance that transactions are recorded as necessary to permit preparation of financial statements in accordance with generally accepted accounting principles, and that receipts and expenditures of the company are being made only in accordance with authorizations of management and directors of the company; and (3) provide reasonable assurance regarding prevention or timely detection of unauthorized acquisition, use, or disposition of the company’s assets that could have a material effect on the financial statements.
Because of its inherent limitations, internal control over financial reporting may not prevent or detect misstatements. Also, projections of any evaluation of effectiveness to future periods are subject to the risk that controls may become inadequate because of changes in conditions, or that the degree of compliance with the policies or procedures may deteriorate.
/s/ Deloitte & Touche LLP
February 17, 2026
81
ITEM 9B. Other Information
None of our directors or officers (as defined in Section 16 of the Exchange Act) adopted terminated
ITEM 9C. Disclosure Regarding Foreign Jurisdictions that Prevent Inspections
Not applicable.
82
PART III
ITEM 10. Directors, Executive Officers and Corporate Governance
DIRECTORS
Information regarding our directors is incorporated herein by reference to the material included under the caption “Proposal 1: Election of Directors” in our Definitive Proxy Statement for our 2026 Annual Meeting of Stockholders which we expect to file with the SEC within 120 days after the end of our 2025 fiscal year (2026 Proxy Statement).
EXECUTIVE OFFICERS
Information regarding our executive officers is incorporated herein by reference to the material included under the caption "Executive Officers" in our 2026 Proxy Statement.
DELINQUENT SECTION 16(a) REPORTS
Information regarding compliance with Section 16(a) of the Exchange Act is incorporated herein by reference to the material included under the caption “Delinquent Section 16(a) Reports” in our 2026 Proxy Statement.
AUDIT COMMITTEE
Information regarding our Finance and Audit Committee is incorporated herein by reference to the material included under the captions “Corporate Governance—Committees of the Board” and “Corporate Governance—Committees of the Board—Finance and Audit Committee” in our 2026 Proxy Statement.
CODE OF ETHICS
We have adopted a Code of Business Conduct and Ethics and a Financial Leadership Code of Ethics applicable to our principal executive officer, principal financial officer, and principal accounting officer. Each of these documents, as well as the charters of the Governance and Corporate Responsibility Committee, the Finance and Audit Committee, the Compensation Committee and the Executive Committee are available on our website at http://investor.lpcorp.com under the “Corporate Governance” tab under the section “Governance Documents”.
A description of any substantive amendment or waiver of our Financial Leadership Code of Ethics or our Code of Business Conduct applicable to our principal executive officer, our principal financial officer and our principal accounting officer will be disclosed on our website at http://investor.lpcorp.com under the “Corporate Governance” tab, in the “Governance Documents” section. Any such description will be located on our website for a period of 12 months following the amendment or waiver.
The information provided on our website is not a part of this annual report on Form 10-K and therefore is not incorporated herein by reference.
INSIDER TRADING POLICY
ITEM 11. Executive Compensation
Information regarding executive compensation is incorporated herein by reference to the material under the captions “Compensation of Executive Officers” and “Corporate Governance—Director Compensation” in our 2026 Proxy Statement. Information regarding our Compensation Committee is incorporated herein by reference to the material under the captions “Corporate Governance—Committees of the Board—Compensation Committee—Compensation Committee Interlocks and Insider Participation” and “Compensation of Executive Officers—Compensation Committee Report” in our 2026 Proxy Statement.
83
ITEM 12. Security Ownership of Certain Beneficial Owners and Management and Related Stockholder Matters
Information regarding security ownership of certain beneficial owners and management and securities authorized for issuance under our existing equity compensation plans and arrangements is incorporated herein by reference to the material under the captions “Holders of Common Stock” and “Equity Compensation Plan Information” in the 2026 Proxy Statement.
ITEM 13. Certain Relationships and Related Transactions, and Director Independence
There are no transactions of the type required to be disclosed by Item 404(a) of Regulation S-K. Information regarding transactions with related persons and director independence is incorporated herein by reference to the material under the captions “Proposal 1: Election of Directors—Nominees for Director,” “Proposal 1: Election of Directors—Continuing Directors,” “Corporate Governance—Principles of Corporate Governance,” and “Related Person Transactions” in the 2026 Proxy Statement.
ITEM 14. Principal Accountant Fees and Services
Information regarding fees and services provided by our principal accountant and the LP Finance and Audit Committee’s pre-approval policies and procedures relating thereto is incorporated herein by reference to the material under the caption “Audit Matters—Pre-Approval of Audit and Permissible Non-Audit Services of Independent Registered Public Accounting Firm” in the 2026 Proxy Statement.
84
PART IV
ITEM 15. Exhibits, Financial Statement Schedules
A. Financial Statements and Financial Statement Schedules
The following financial statements of LP are included in this annual report on Form 10-K:
Consolidated Balance Sheets—December 31, 2025 and 2024.
Consolidated Statements of Income—years ended December 31, 2025, 2024, and 2023.
Consolidated Statements of Comprehensive Income—years ended December 31, 2025, 2024 and 2023.
Consolidated Statements of Cash Flows—years ended December 31, 2025, 2024, 2023.
Consolidated Statements of Stockholders’ Equity—years ended December 31, 2025, 2024 and 2023.
Notes to the Consolidated Financial Statements.
Report of Independent Registered Public Accounting Firm. (PCAOB ID No. 34 )
No other financial statement schedules are required to be filed.
B. Exhibits
The exhibits filed or furnished, as applicable, as part of this annual report on Form 10-K or incorporated by reference herein are listed below. Each management contract or compensatory plan or arrangement is identified by an asterisk (*). Each prior LP filing, which contains an exhibit incorporated by reference herein, is filed under SEC File No. 001-07107.
85
10.5 | ||||||||
10.6 | ||||||||
10.7 | ||||||||
10.8 | ||||||||
10.9 | ||||||||
10.10 | ||||||||
10.11 | ||||||||
10.12 | ||||||||
| 10.13 | ||||||||
10.14 | ||||||||
10.15 | ||||||||
10.16 | ||||||||
10.17 | ||||||||
10.18 | ||||||||
| 19 | ||||||||
| 21 | ||||||||
| 23 | ||||||||
| 31.1 | ||||||||
| 31.2 | ||||||||
| 32 | ||||||||
| 97 | ||||||||
86
| 101.INS | Inline XBRL Instance Document. + | |||||||
| 101.SCH | Inline XBRL Taxonomy Extension Schema Document. + | |||||||
| 101.CAL | Inline XBRL Taxonomy Extension Calculation Linkbase Document. + | |||||||
| 101.LAB | Inline XBRL Taxonomy Extension Label Linkbase Document. + | |||||||
| 101.PRE | Inline XBRL Taxonomy Extension Presentation Linkbase Document. + | |||||||
| 101.DEF | Inline XBRL Taxonomy Extension Definition Linkbase Document. + | |||||||
| 104 | Cover Page Interactive Data File (embedded with Inline XBRL document and contained in Exhibit 101). +* | |||||||
* Indicates a management contract or compensatory plan or arrangement.
+ Filed herewith.
++ Furnished herewith.
ITEM 16. Form 10-K Summary
None.
87
SIGNATURES
Pursuant to the requirements of Section 13 or 15(d) of the Securities Exchange Act of 1934, the registrant has duly caused this report to be signed on its behalf by the undersigned, thereunto duly authorized.
| Date: | February 17, 2026 | LOUISIANA-PACIFIC CORPORATION (Registrant) | ||||||
/s/ Alan J.M. Haughie | ||||||||
Alan J.M. Haughie Executive Vice President and Chief Financial Officer | ||||||||
88
Pursuant to the requirements of the Securities Exchange Act of 1934, this report has been signed below by the following persons on behalf of the registrant and in the capacities and on the dates indicated.
| Date | Signature and Title | |||||||
| February 17, 2026 | /s/ W. Bradley Southern | |||||||
W. Bradley Southern Chairperson of the Board Chief Executive Officer (Principal Executive Officer) | ||||||||
| February 17, 2026 | /s/ Alan J.M. Haughie | |||||||
Alan J.M. Haughie Executive Vice President and Chief Financial Officer (Principal Financial Officer) | ||||||||
| February 17, 2026 | /s/ Leslie E. Davis | |||||||
Leslie E. Davis Vice President, Controller and Chief Accounting Officer (Principal Accounting Officer) | ||||||||
| February 17, 2026 | /s/ Kelly H. Barrett | |||||||
Kelly H. Barrett Director | ||||||||
| February 17, 2026 | /s/ Jose A. Bayardo | |||||||
Jose A. Bayardo Director | ||||||||
| February 17, 2026 | /s/ Lizanne M. Bruce | |||||||
Lizanne M. Bruce Director | ||||||||
| February 17, 2026 | /s/ F. Nicholas Grasberger III | |||||||
F. Nicholas Grasberger III Director | ||||||||
| February 17, 2026 | /s/ Ozey K. Horton, Jr. | |||||||
Ozey K. Horton, Jr. Director | ||||||||
| February 17, 2026 | /s/ Stephen E. Macadam | |||||||
Stephen E. Macadam Director | ||||||||
| February 17, 2026 | /s/ Dustan E. McCoy | |||||||
Dustan E. McCoy Director | ||||||||
| February 17, 2026 | /s/ Jean-Michel Ribiéras | |||||||
Jean-Michel Ribiéras Director | ||||||||
| February 17, 2026 | /s/ Ty R. Silberhorn | |||||||
Ty R. Silberhorn Director | ||||||||
89
Exhibit 21
Domestic Subsidiaries
Ketchikan Pulp Company
Entekra Holdings, LLC
Entekra, LLC
Entekra Truss, LLC
Foreign Subsidiaries
Louisiana-Pacific Canada Holdings Ltd.
Louisiana-Pacific Canada Ltd.
Louisiana-Pacific South America S.A.
Louisiana-Pacific Mexico
LP Brasil OSB Industria E. Comercio S.A.
Louisiana-Pacific Chile S.A.
Louisiana-Pacific del Perú S.A.C.
Louisiana-Pacific Argentina S.R.L.
Louisiana-Pacific Colombia S.A.S.
Louisiana-Pacific Paraguay S.A.
Entekra Ltd
Exhibit 23
CONSENT OF INDEPENDENT REGISTERED PUBLIC ACCOUNTING FIRM
We consent to the incorporation by reference in Registration Statement Nos. 333-228608, 333-156144, 333-153080, 333-118269, 333-87775, 333-188447, 333-110243, 333-264538, and 333-49106 on Form S-8 of our reports dated February 17, 2026, relating to the consolidated financial statements of Louisiana-Pacific Corporation and subsidiaries (the “Company”), and the effectiveness of the Company’s internal control over financial reporting appearing in this Annual Report on Form 10-K of Louisiana-Pacific Corporation for the year ended December 31, 2025.
/s/ Deloitte & Touche LLP
Nashville, Tennessee
February 17, 2026
Exhibit 31.1
CERTIFICATIONS
I, W. Bradley Southern, certify that:
1. I have reviewed this annual report on Form 10-K of Louisiana-Pacific Corporation;
2. Based on my knowledge, this report does not contain any untrue statement of a material fact or omit to state a material fact necessary to make the statements made, in light of the circumstances under which such statements were made, not misleading with respect to the period covered by this report;
3. Based on my knowledge, the financial statements, and other financial information included in this report, fairly present in all material respects the financial condition, results of operations and cash flows of the registrant as of, and for, the periods presented in this report;
4. The registrant’s other certifying officer and I are responsible for establishing and maintaining disclosure controls and procedures (as defined in Exchange Act Rules 13a-15(e) and 15d-15(e)) and internal control over financial reporting (as defined in Exchange Act Rules 13a-15(f) and 15d-15(f)) for the registrant and have:
a)designed such disclosure controls and procedures, or caused such disclosure controls and procedures to be designed under our supervision, to ensure that material information relating to the registrant, including its consolidated subsidiaries, is made known to us by others within those entities, particularly during the period in which this report is being prepared;
b)designed such internal control over financial reporting, or caused such internal control over financial reporting to be designed under our supervision, to provide reasonable assurance regarding the reliability of financial reporting and the preparation of financial statements for external purposes in accordance with generally accepted accounting principles;
c)evaluated the effectiveness of the registrant’s disclosure controls and procedures and presented in this report our conclusions about the effectiveness of the disclosure controls and procedures, as of the end of the period covered by this report based on such evaluation; and
d)disclosed in this report any change in the registrant’s internal control over financial reporting that occurred during the registrant’s most recent fiscal quarter (the registrant’s fourth fiscal quarter in the case of an annual report) that has materially affected, or is reasonably likely to materially affect, the registrant’s internal control over financial reporting; and
5. The registrant’s other certifying officer and I have disclosed, based on our most recent evaluation of internal control over financial reporting, to the registrant’s auditors and the audit committee of the registrant’s board of directors (or persons performing the equivalent functions):
a)all significant deficiencies and material weaknesses in the design or operation of internal control over financial reporting which are reasonably likely to adversely affect the registrant’s ability to record, process, summarize and report financial information; and
b)any fraud, whether or not material, that involves management or other employees who have a significant role in the registrant’s internal control over financial reporting.
| Date: | February 17, 2026 | /s/ W. Bradley Southern | |||||||||
| W. Bradley Southern Chief Executive Officer | |||||||||||
Exhibit 31.2
CERTIFICATIONS
I, Alan J.M. Haughie, certify that:
1.I have reviewed this annual report on Form 10-K of Louisiana-Pacific Corporation;
2.Based on my knowledge, this report does not contain any untrue statement of a material fact or omit to state a material fact necessary to make the statements made, in light of the circumstances under which such statements were made, not misleading with respect to the period covered by this report;
3.Based on my knowledge, the financial statements, and other financial information included in this report, fairly present in all material respects the financial condition, results of operations and cash flows of the registrant as of, and for, the periods presented in this report;
4.The registrant’s other certifying officer and I are responsible for establishing and maintaining disclosure controls and procedures (as defined in Exchange Act Rules 13a-15(e) and 15d-15(e)) and internal control over financial reporting (as defined in Exchange Act Rules 13a-15(f) and 15d-15(f)) for the registrant and have:
a)designed such disclosure controls and procedures, or caused such disclosure controls and procedures to be designed under our supervision, to ensure that material information relating to the registrant, including its consolidated subsidiaries, is made known to us by others within those entities, particularly during the period in which this report is being prepared;
b)designed such internal control over financial reporting, or caused such internal control over financial reporting to be designed under our supervision, to provide reasonable assurance regarding the reliability of financial reporting and the preparation of financial statements for external purposes in accordance with generally accepted accounting principles;
c)evaluated the effectiveness of the registrant’s disclosure controls and procedures and presented in this report our conclusions about the effectiveness of the disclosure controls and procedures, as of the end of the period covered by this report based on such evaluation; and
d)disclosed in this report any change in the registrant's internal control over financial reporting that occurred during the registrant's most recent fiscal quarter (the registrant's fourth fiscal quarter in the case of an annual report) that has materially affected, or is reasonably likely to materially affect, the registrant's internal control over financial reporting; and
5.The registrant’s other certifying officer and I have disclosed, based on our most recent evaluation of internal control over financial reporting, to the registrant’s auditors and the audit committee of the registrant’s board of directors (or persons performing the equivalent functions):
a)all significant deficiencies and material weaknesses in the design or operation of internal control over financial reporting which are reasonably likely to adversely affect the registrant’s ability to record, process, summarize and report financial information; and
b)any fraud, whether or not material, that involves management or other employees who have a significant role in the registrant’s internal control over financial reporting.
| Date: | February 17, 2026 | /s/ Alan J.M. Haughie | ||||||
| Alan J.M. Haughie | ||||||||
| Executive Vice President and Chief Financial Officer | ||||||||
Exhibit 32
LOUISIANA-PACIFIC CORPORATION
1610 West End Ave, Suite 200
Nashville, TN 37203
(615) 986-5600
February 17, 2026
Securities and Exchange Commission
Judiciary Plaza
450 Fifth Street, N.W.
Washington, D.C. 20549
Re: Certification Pursuant to Section 906 of the Sarbanes-Oxley Act of 2002
Ladies and Gentlemen:
Pursuant to 18 U.S.C. § 1350, as adopted pursuant to Section 906 of the Sarbanes-Oxley Act of 2002, in connection with the annual report on Form 10-K of Louisiana-Pacific Corporation (the “Company”) for the fiscal year ended December 31, 2025, as filed with the Securities and Exchange Commission on the date hereof (the “Report”), each of the undersigned officers of the Company certifies, that, to such officer’s knowledge:
(1)The Report fully complies with the requirements of Section 13(a) or 15(d) of the Securities Exchange Act of 1934, as amended; and
(2)The information contained in the Report fairly presents, in all material respects, the financial condition and results of operations of the Company as of the dates and for the periods expressed in the Report.
| /s/ W. Bradley Southern | ||
| Name: W. Bradley Southern Title: Chief Executive Officer | ||
| /s/ Alan J.M. Haughie | ||
| Name: Alan J.M. Haughie Title: Executive Vice President and Chief Financial Officer | ||
A signed original of this written statement required by Section 906 has been provided to Louisiana-Pacific Corporation and will be retained by Louisiana-Pacific Corporation and furnished to the Securities and Exchange Commission or its staff upon request.